6-K
UNITED STATES
SECURITIES AND EXCHANGE COMMISSION
Washington, DC 20549
FORM 6-K
REPORT OF FOREIGN PRIVATE ISSUER
PURSUANT TO RULE 13a-16 OR 15d-16
UNDER THE SECURITIES EXCHANGE ACT OF 1934
For the month of August 2026
Commission File Number 001-37928
ChipMOS TECHNOLOGIES INC.
(Translation of Registrant’s Name into English)
No. 1, R&D Rd. 1, Hsinchu Science Park
Hsinchu, Taiwan
Republic of China
(Address of Principal Executive Offices)
(Indicate by check mark whether the registrant files or will file annual reports under cover of Form 20-F or Form 40-F.)
Form 20-F ☒ Form 40-F ☐
SIGNATURES
Pursuant to the requirements of the Securities Exchange Act of 1934, the registrant has duly caused this report to be signed on its behalf by the undersigned, thereunto duly authorized.
|
|
|
|
|
|
|
|
|
|
|
|
|
|
Dated: August 11, 2026 |
|
|
|
ChipMOS TECHNOLOGIES INC. (Registrant) |
|
|
|
|
|
|
|
|
By: |
|
/S/ S. J. Cheng |
|
|
|
|
Name: |
|
S. J. Cheng |
|
|
|
|
Title: |
|
Chairman & President |
EX-99.1
|
|

|
Exhibit 99.1 |
|
|
Contacts: In Taiwan Jesse Huang ChipMOS TECHNOLOGIES INC. +886-6-5052388 ext. 7715 IR@chipmos.com |
In the U.S. David Pasquale Global IR Partners +1-914-337-8801 dpasquale@globalirpartners.com |
ChipMOS REPORTS SECOND QUARTER 2026 RESULTS; RECORD HIGH QUARTERLY REVENUE SINCE 2014
•28.7% Increase in 2Q26 Revenue Compared to 2Q25
•Gross Margin Expands to 18%
•2Q26 Net Earnings of NT$1.28 or US$0.04 per Basic Common Share Compared to a 2Q25 Net Loss of NT$0.75 or US$0.02 per Basic Common Share
•2Q26 Net Earnings of US$0.80 per Basic ADS Compared to a 2Q25 Net Loss of US$0.47 per Basic ADS
•Cash and Cash Equivalents Balance of NT$12,552.3 Million or US$394.1 Million
•Cash Dividend Distributed from Capital Surplus of NT$1.23 per Common Share on July 17, 2026 and US$0.760 per ADS on July 24, 2026
Hsinchu, Taiwan – August 11, 2026 - ChipMOS TECHNOLOGIES INC. (“ChipMOS” or the “Company”) (Taiwan Stock Exchange: 8150 and Nasdaq: IMOS), an industry leading provider of outsourced semiconductor assembly and test services (“OSAT”), today reported consolidated financial results for the second quarter ended June 30, 2026. All U.S. dollar figures cited in this press release are based on the exchange rate of NT$31.85 against US$1.00 as of June 30, 2026.
All the figures were prepared in accordance with Taiwan-International Financial Reporting Standards (“Taiwan-IFRS”).
Revenue for the second quarter of 2026 was NT$7,383.1 million or US$231.8 million, an increase of 6.5% from NT$6,935.6 million or US$217.8 million in the first quarter of 2026 and an increase of 28.7% from NT$5,735.8 million or US$180.1 million for the same period in 2025. Gross margin for the second quarter of 2026 was 18% compared to 13.8% in the first quarter of 2026, and 6.6% in the same period in 2025.
Net non-operating income in the second quarter of 2026 was NT$78.9 million or US$2.5 million, compared to NT$78.5 million or US$2.5 million in the first quarter of 2026, and net non-operating expenses of NT$682.2 million or US$21.4 million in the second quarter of 2025. The difference between the second quarter of 2025 is mainly due to the decrease of foreign exchange loss of NT$685 million or US$21.5 million and the positive impact on valuation of financial assets at fair value through profit or loss of NT$80 million or US$2.5 million from the loss on valuation of financial assets at fair value through profit or loss of NT$2 million or US$0.1 million in the second quarter of 2025 to the gain on valuation of financial assets at fair value through profit or loss of NT$78 million or US$2.4 million in the second quarter of 2026.
Net profit attributable to equity holders of the Company for the second quarter of 2026 was NT$891.7 million or US$28.0 million, and NT$1.28 or US$0.04 per basic common share, as compared to NT$504.9 million or US$15.9 million, and NT$0.72 or US$0.02 per basic common share in the first quarter of 2026. This compares to net loss attributable to equity holders of the Company for the second quarter of 2025 was NT$533.1 million or US$16.7 million, and NT$0.75 or US$0.02 per basic common share. Net earnings for the second quarter of 2026 were US$0.80 per basic ADS, compared to US$0.45 per basic ADS for the first quarter of 2026 and net losses of US$0.47 per basic ADS in the second quarter of 2025.
Net free cash inflow for the first half of 2026 was NT$735.9 million or US$23.1 million with a strong balance of cash and cash equivalents was NT$12,552.3 million or US$394.1 million.
Second Quarter 2026 Investor Semiannual Conference Call / Webcast Details
Date: Tuesday, August 11, 2026
Time: 3:00PM Taiwan (3:00AM New York)
Dial-In: +886-2-33961191
Password: 1637011 #
Semiannual Conference Call Webcast and Replay: https://www.chipmos.com/chinese/ir/info2.aspx
Replay: Starts approximately 2 hours after the live call ends
Language: Mandarin
Note: A transcript will be provided on the Company’s website in English following the semiannual conference call to help ensure transparency, and to facilitate a better understanding of the Company’s financial results and operating environment.
About ChipMOS TECHNOLOGIES INC.:
ChipMOS TECHNOLOGIES INC. (“ChipMOS” or the “Company”) (Taiwan Stock Exchange: 8150 and Nasdaq: IMOS) (www.chipmos.com) is an industry leading provider of outsourced semiconductor assembly and test services. With advanced facilities in Hsinchu Science Park, Hsinchu Industrial Park and Southern Taiwan Science Park in Taiwan, ChipMOS is known for its track record of excellence and history of innovation. The Company provides end-to-end assembly and test services to leading fabless semiconductor companies, integrated device manufacturers and independent semiconductor foundries serving virtually all end markets worldwide.
Forward-Looking Statements
This press release may contain certain forward-looking statements. These forward-looking statements may be identified by words such as ‘believes,’ ‘expects,’ ‘anticipates,’ ‘projects,’ ‘intends,’ ‘should,’ ‘seeks,’ ‘estimates,’ ‘future’ or similar expressions or by discussion of, among other things, strategies, goals, plans or intentions. These statements may include financial projections and estimates and their underlying assumptions, statements regarding current macroeconomic conditions, including the impacts of high inflation, foreign exchange rates and risk of recession, on demand for our products, consumer confidence and financial markets generally; changes in trade regulations, policies, and agreements and the imposition of tariffs that affect our products or operations, including potential new tariffs that may be imposed and our ability to mitigate with respect to future operations, products and services, and statements regarding future performance. Actual results may differ materially in the future from those reflected in forward-looking statements contained in this document, based on a number of important factors and risks, which are more specifically identified in the Company’s most recent U.S. Securities and Exchange Commission (the “SEC”) filings. Further information regarding these risks, uncertainties and other factors are included in the Company’s most recent Annual Report on Form 20-F filed with the SEC and in its other filings with the SEC.

August 2026 Industry Leading Provider of Outsourced Semiconductor Assembly, Test & Bumping Services 2Q26 Results Conference Exhibit 99.2
Safe Harbor Notice This presentation contains certain forward-looking statements. These forward-looking statements may be identified by words such as ‘believes,’ ‘expects,’ ‘anticipates,’ ‘projects,’ ‘intends,’ ‘should,’ ‘seeks,’ ‘estimates,’ ‘future’ or similar expressions or by discussion of, among other things, strategies, goals, plans or intentions. These statements may include financial projections and estimates and their underlying assumptions, statements regarding current macroeconomic conditions, including the impacts of high inflation, foreign exchange rates and risk of recession, on demand for our products, consumer confidence and financial markets generally; changes in trade regulations, policies, and agreements and the imposition of tariffs that affect our products or operations, including potential new tariffs that may be imposed and our ability to mitigate with respect to future operations, products and services, and statements regarding future performance. Actual results may differ materially in the future from those reflected in forward-looking statements contained in this document, based on a number of important factors and risks, which are more specifically identified in the Company’s most recent U.S. Securities and Exchange Commission (the “SEC”) filings. Further information regarding these risks, uncertainties and other factors are included in the Company’s most recent Annual Report on Form 20-F filed with the SEC and in its other filings with the SEC.
Agenda Welcome 2Q26 Operating Results S.J. Cheng 2Q26 Financial Results Silvia Su Business Outlook S.J. Cheng Q&A
4 2Q26 Operating Results
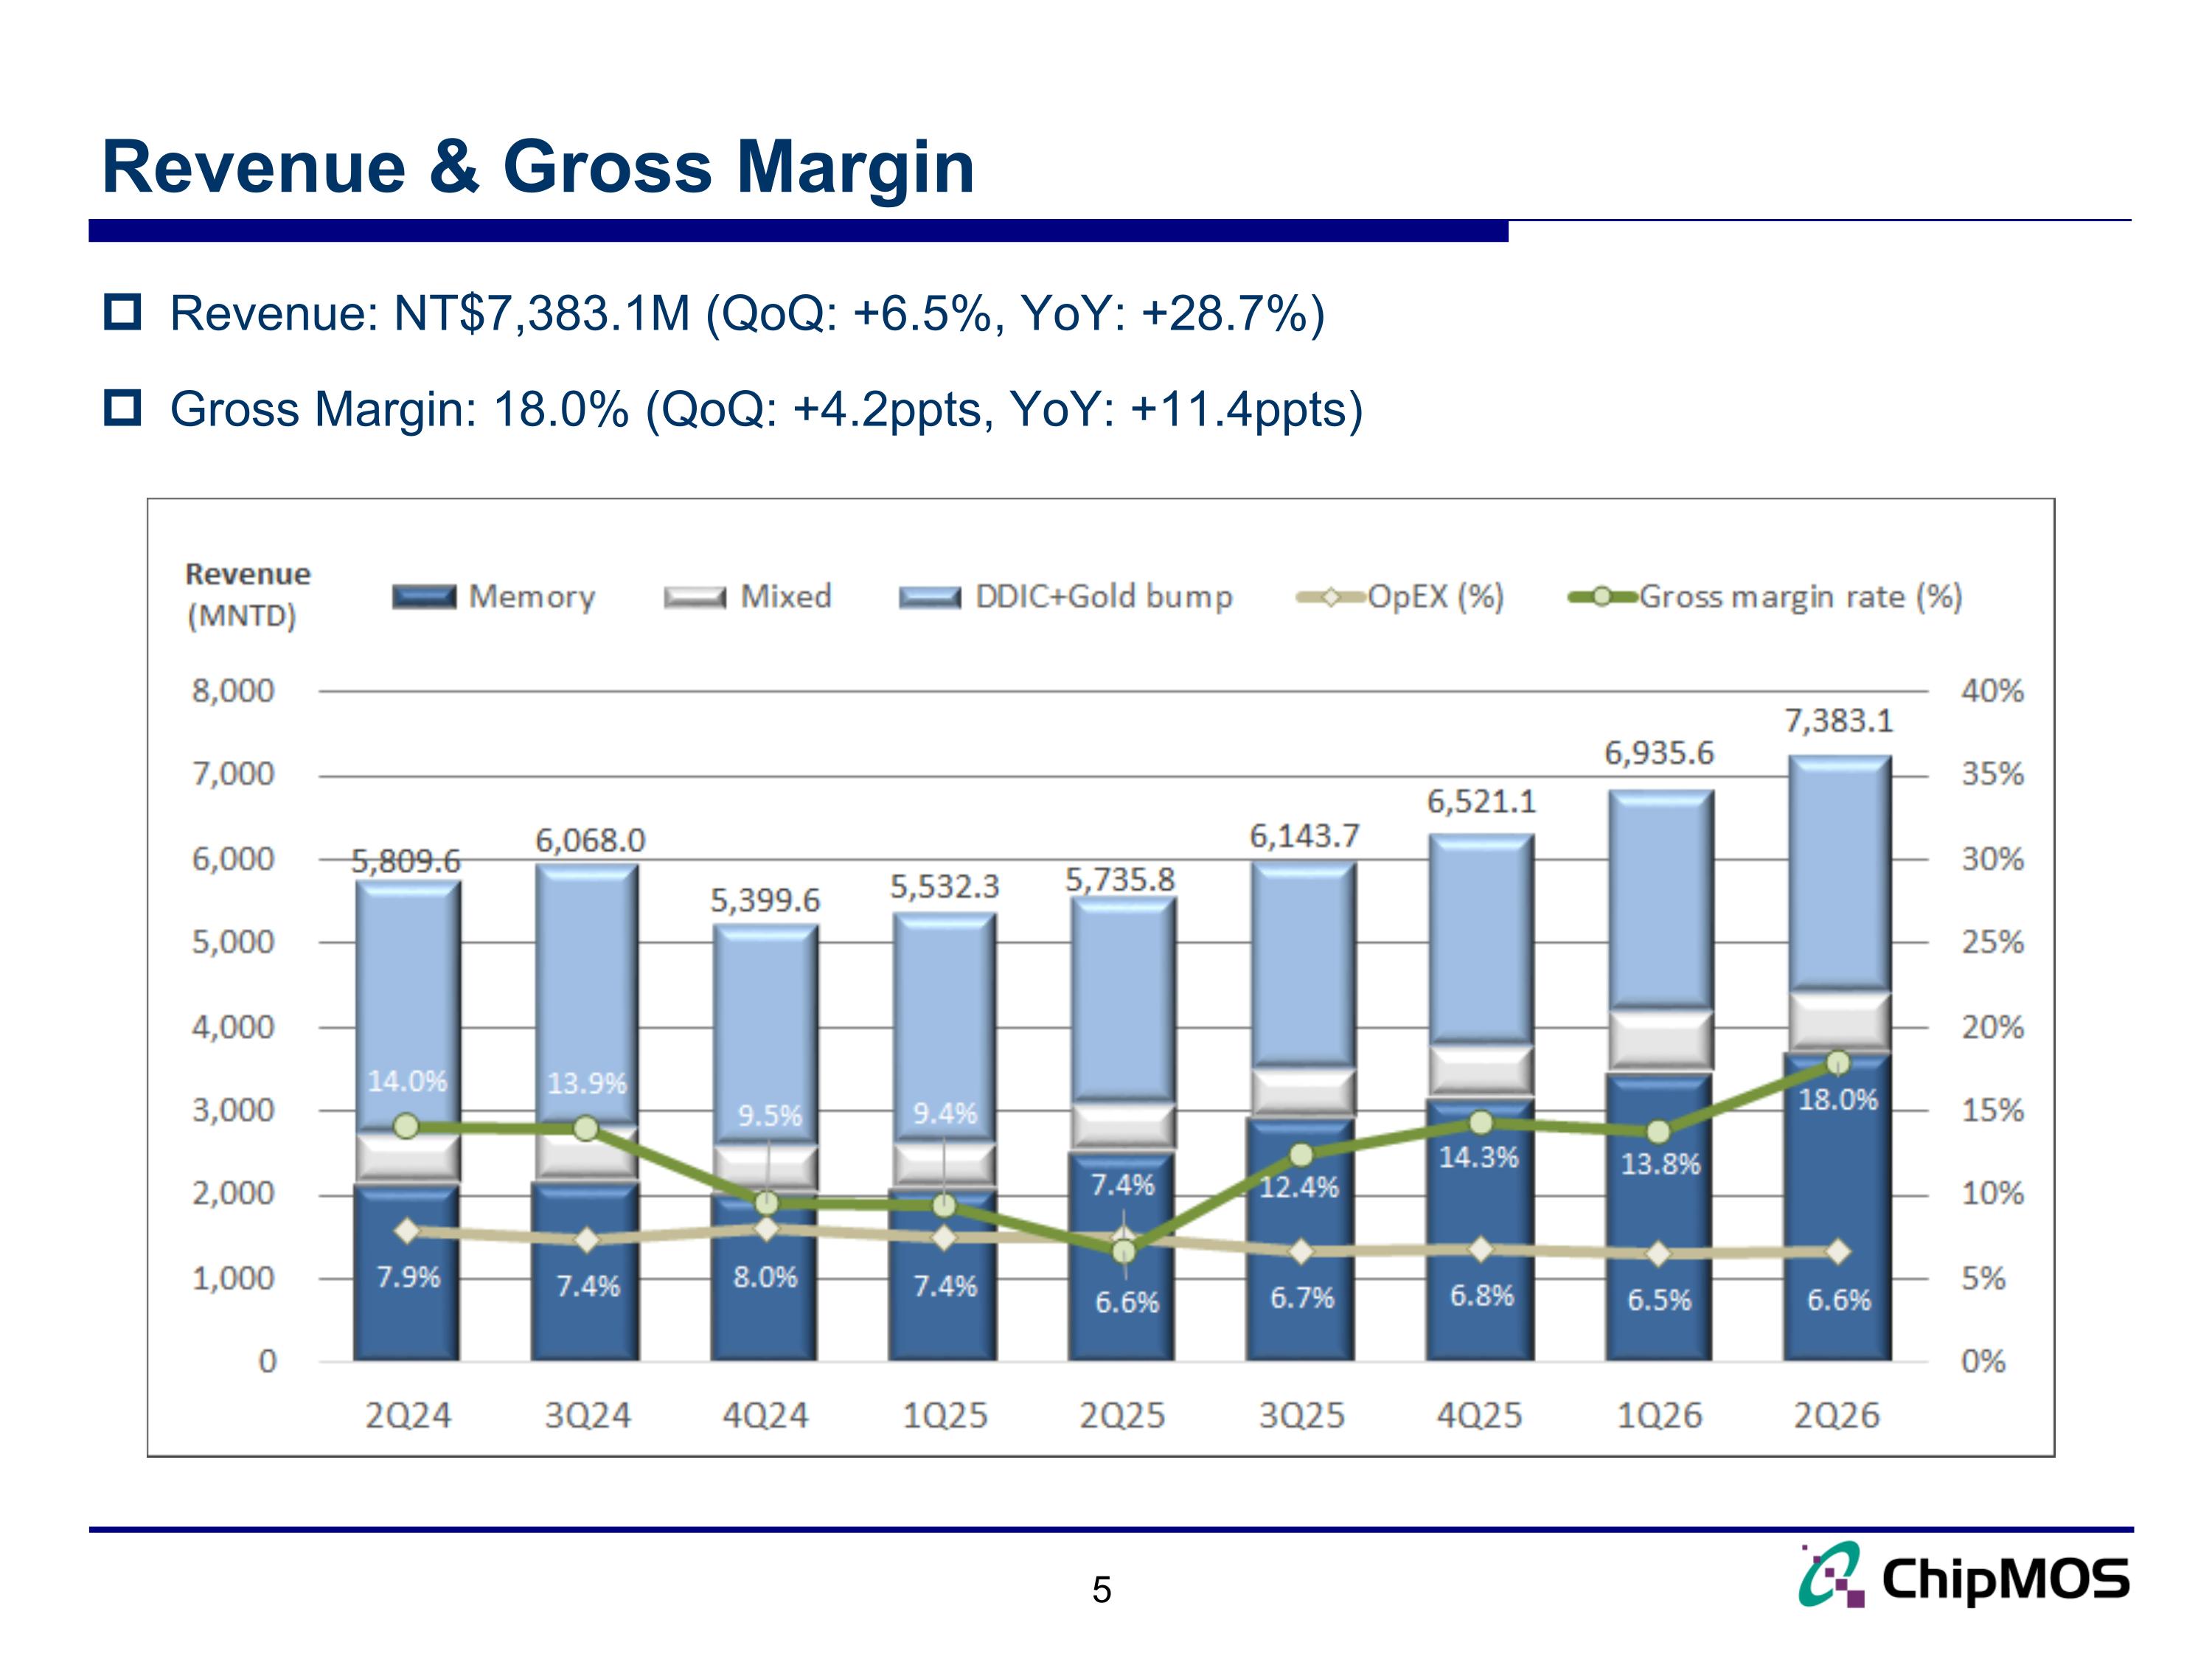
Revenue: NT$7,383.1M (QoQ: +6.5%, YoY: +28.7%) Gross Margin: 18.0% (QoQ: +4.2ppts, YoY: +11.4ppts) Revenue & Gross Margin 5
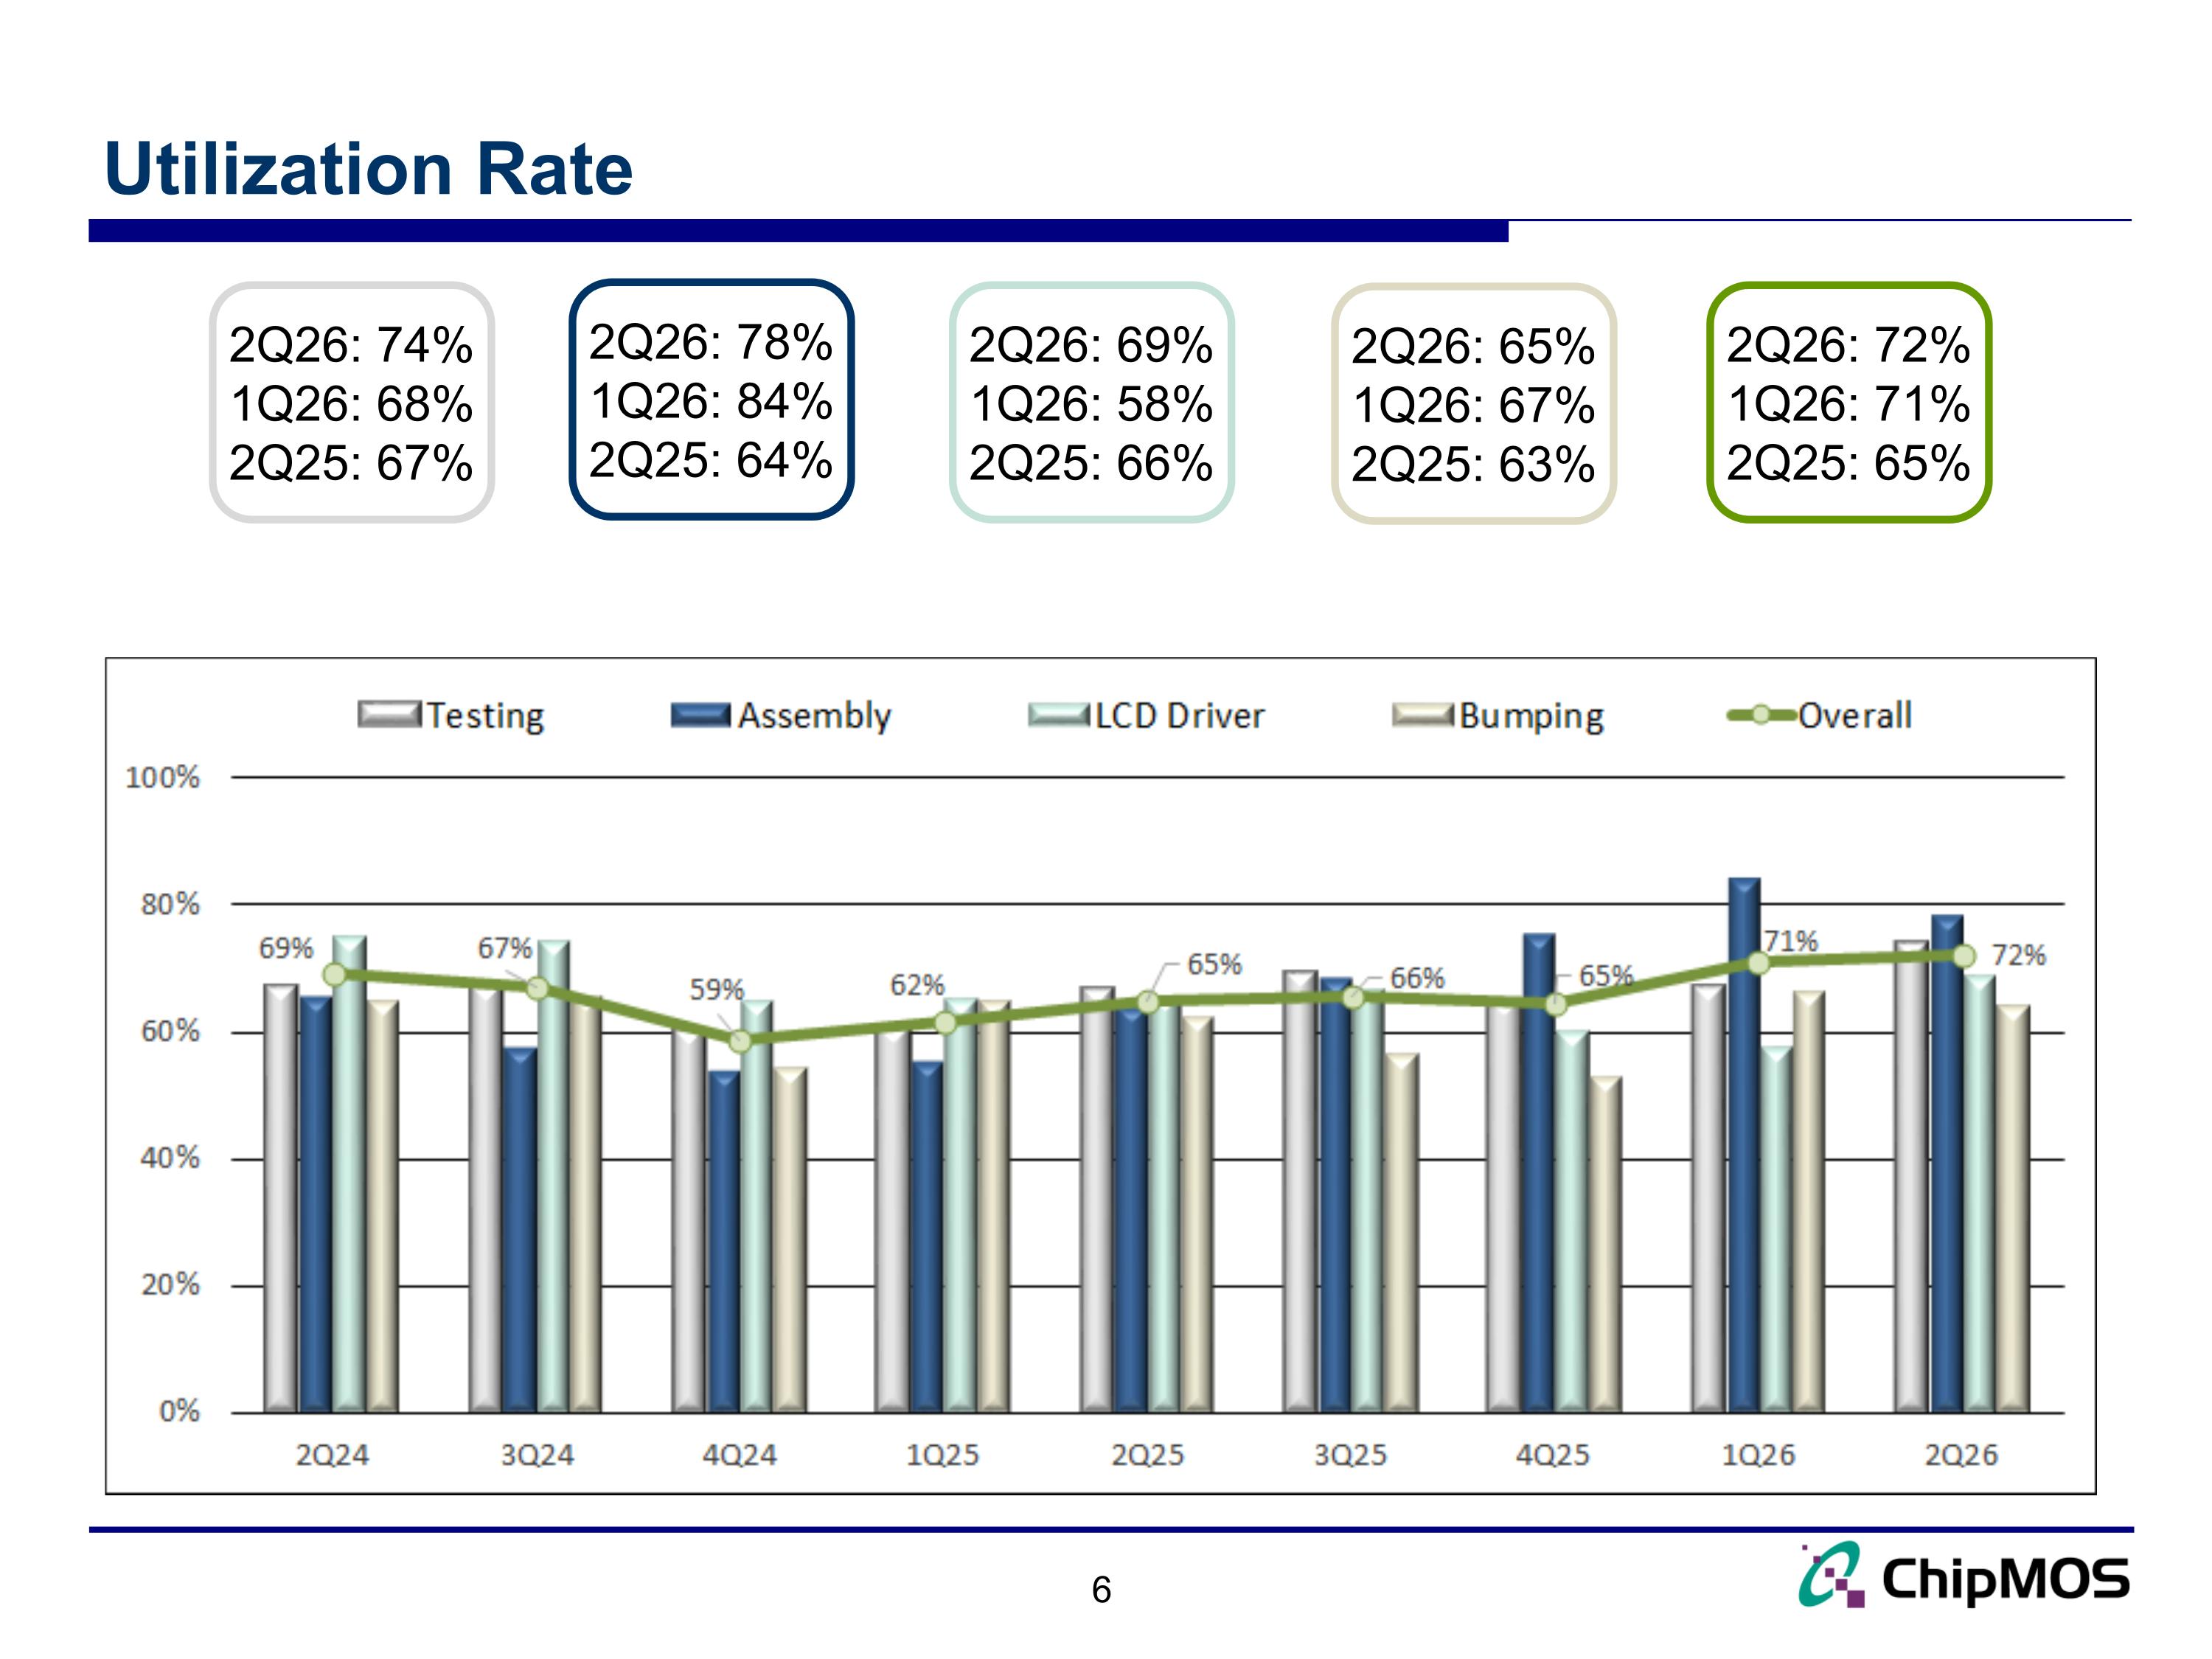
Utilization Rate 6 2Q26: 78% 1Q26: 84% 2Q25: 64% 2Q26: 65% 1Q26: 67% 2Q25: 63% 2Q26: 69% 1Q26: 58% 2Q25: 66% 2Q26: 72% 1Q26: 71% 2Q25: 65% 2Q26: 74% 1Q26: 68% 2Q25: 67%
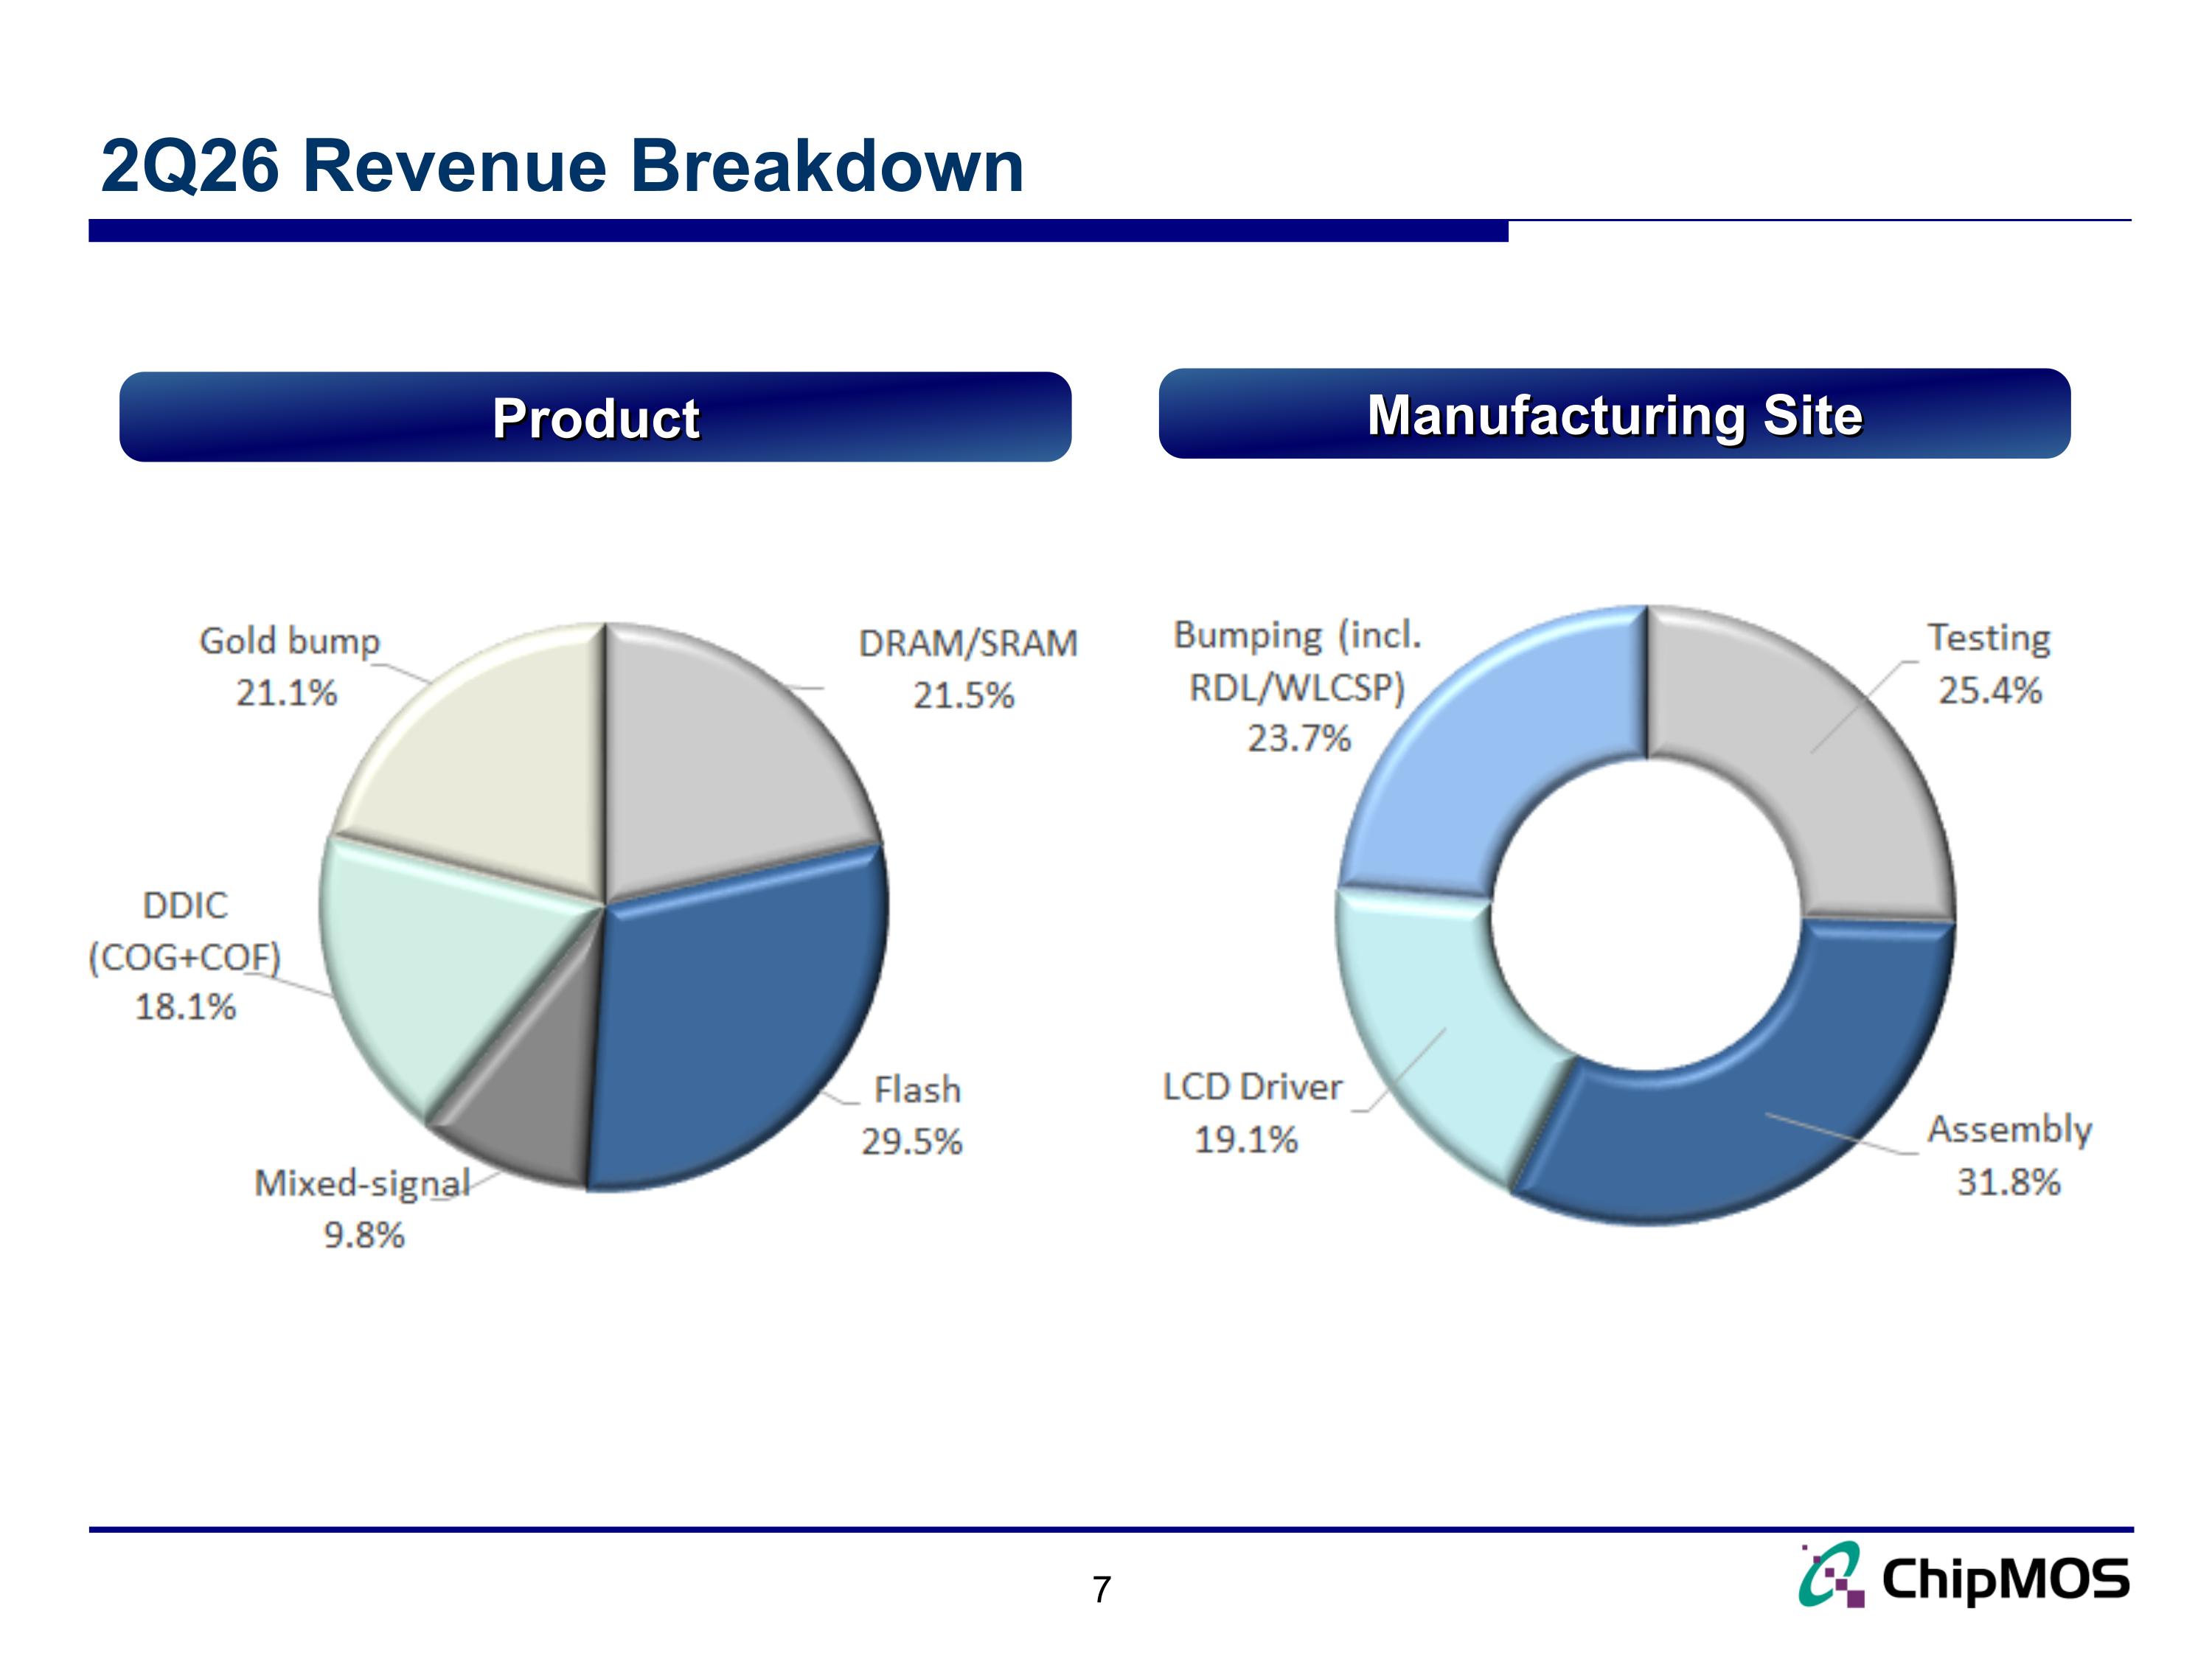
2Q26 Revenue Breakdown Product Manufacturing Site
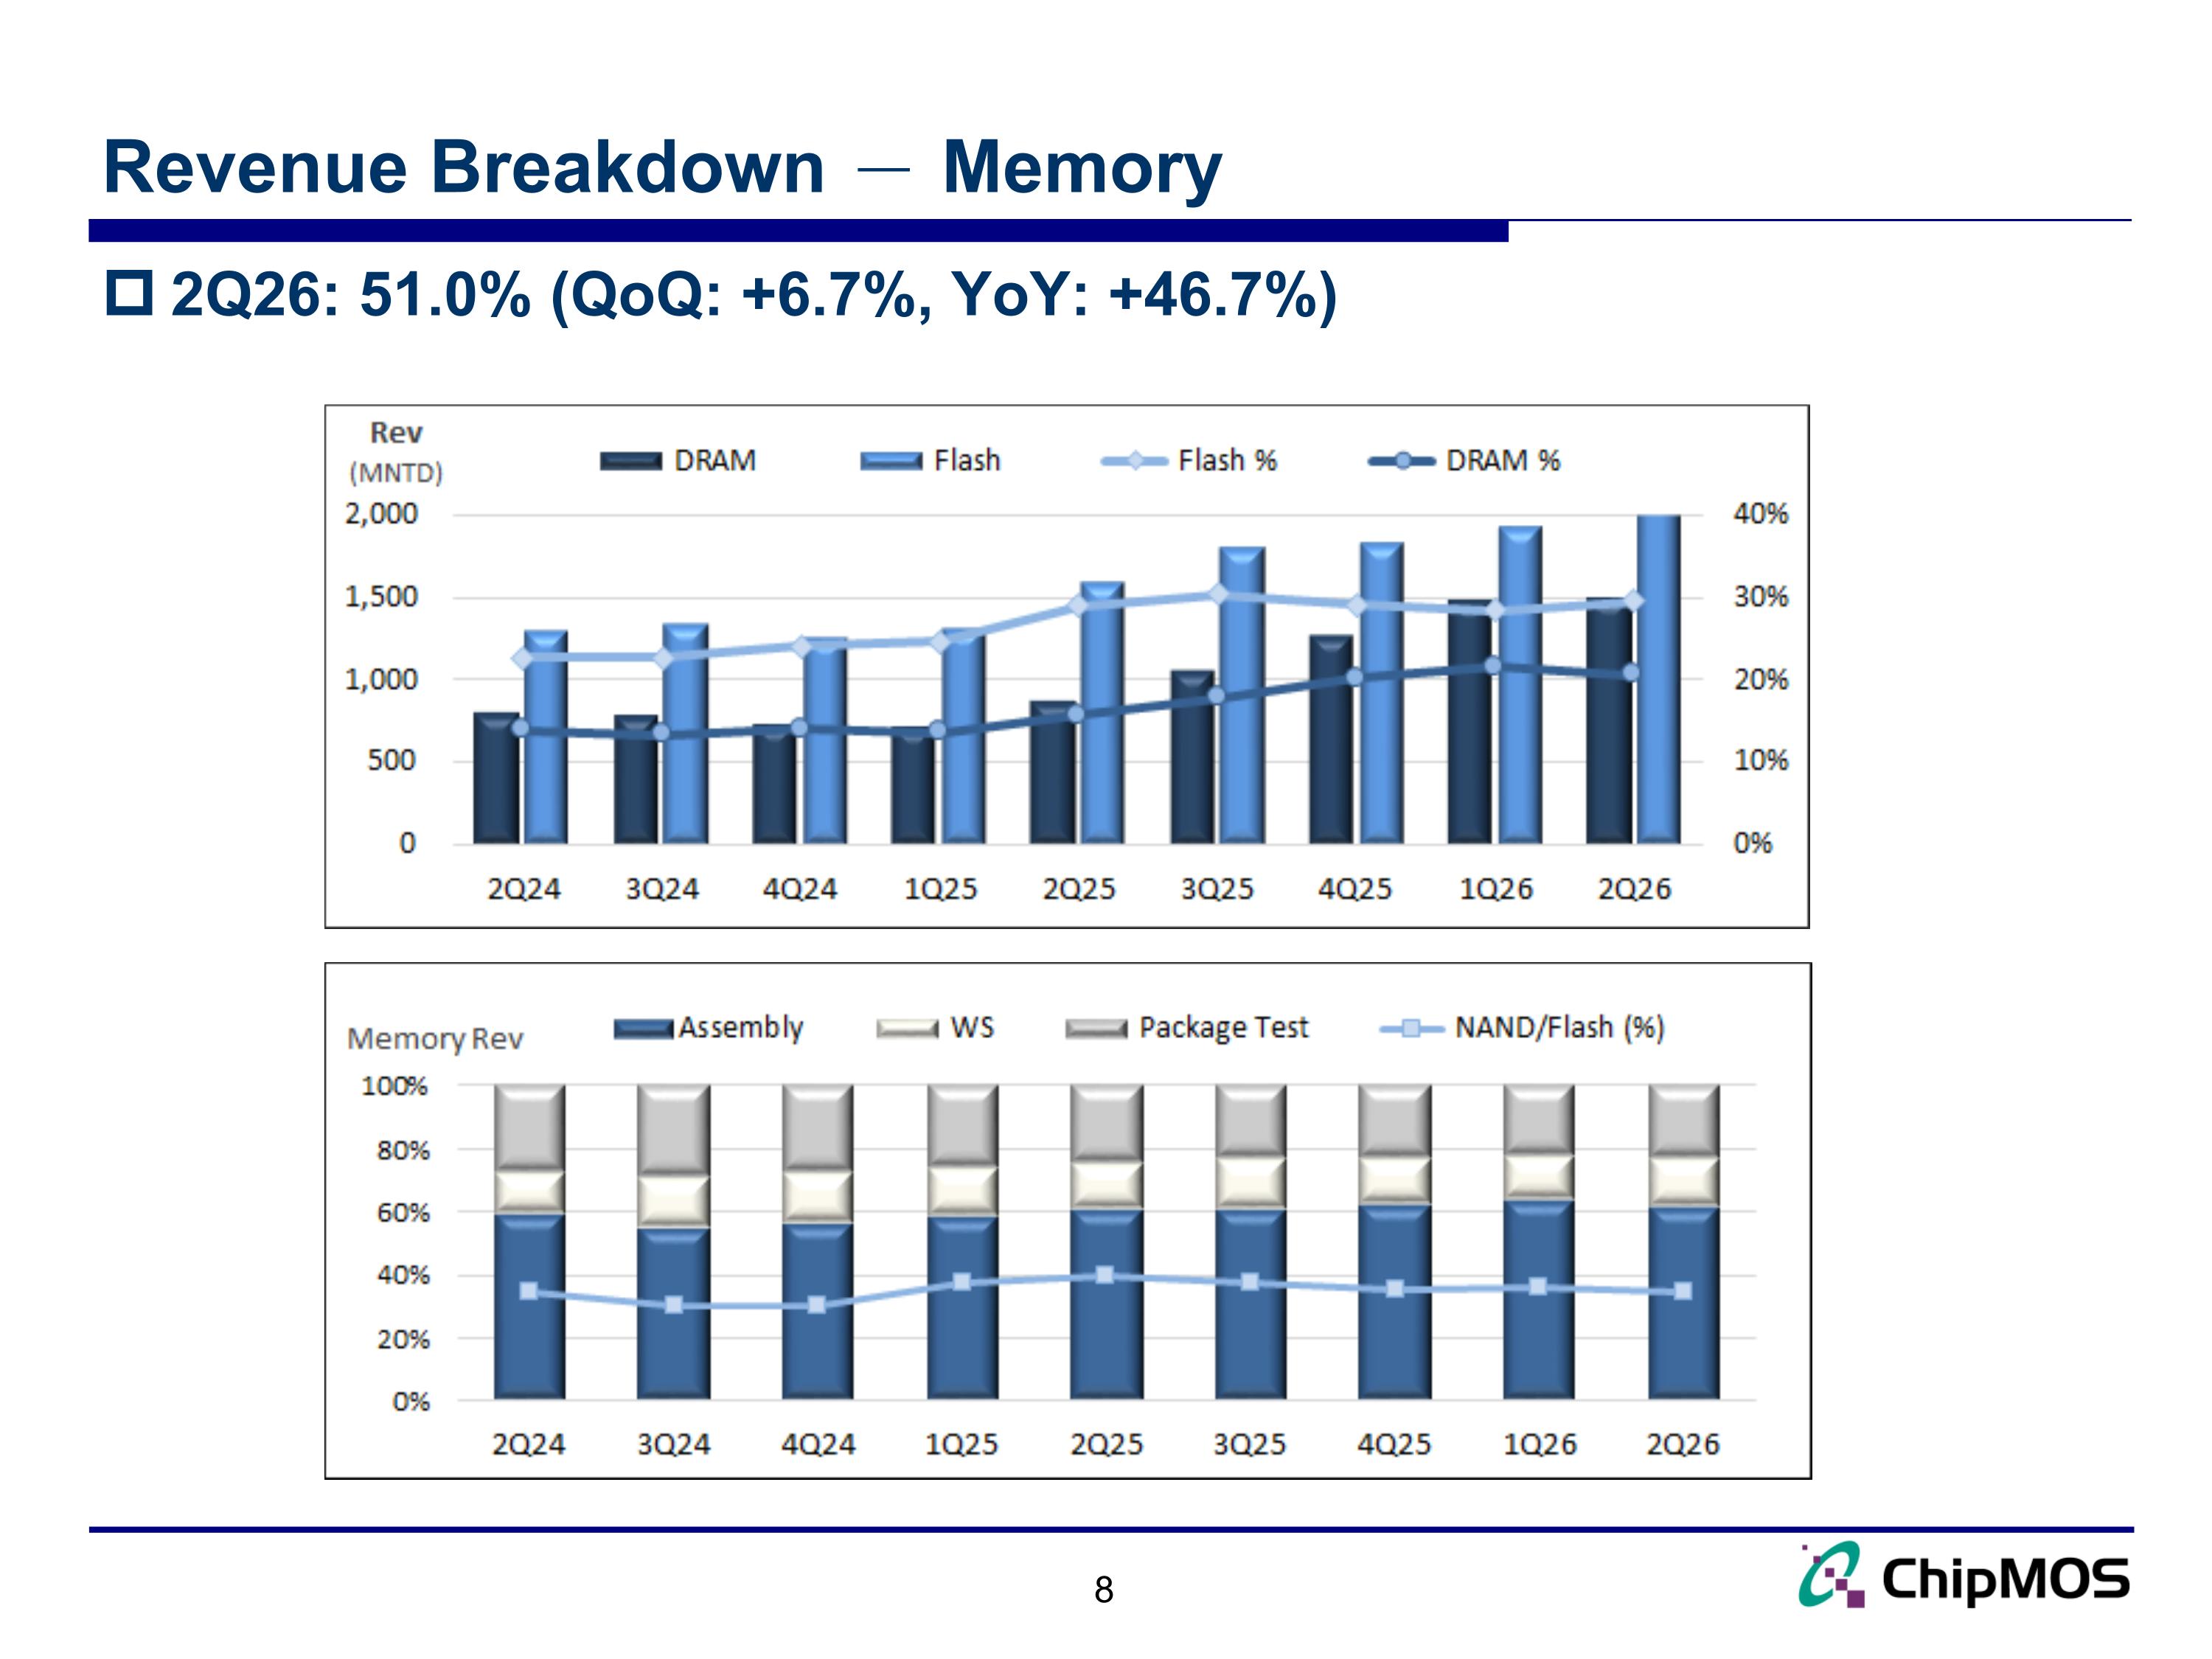
Revenue Breakdown - Memory 8 2Q26: 51.0% (QoQ: +6.7%, YoY: +46.7%)
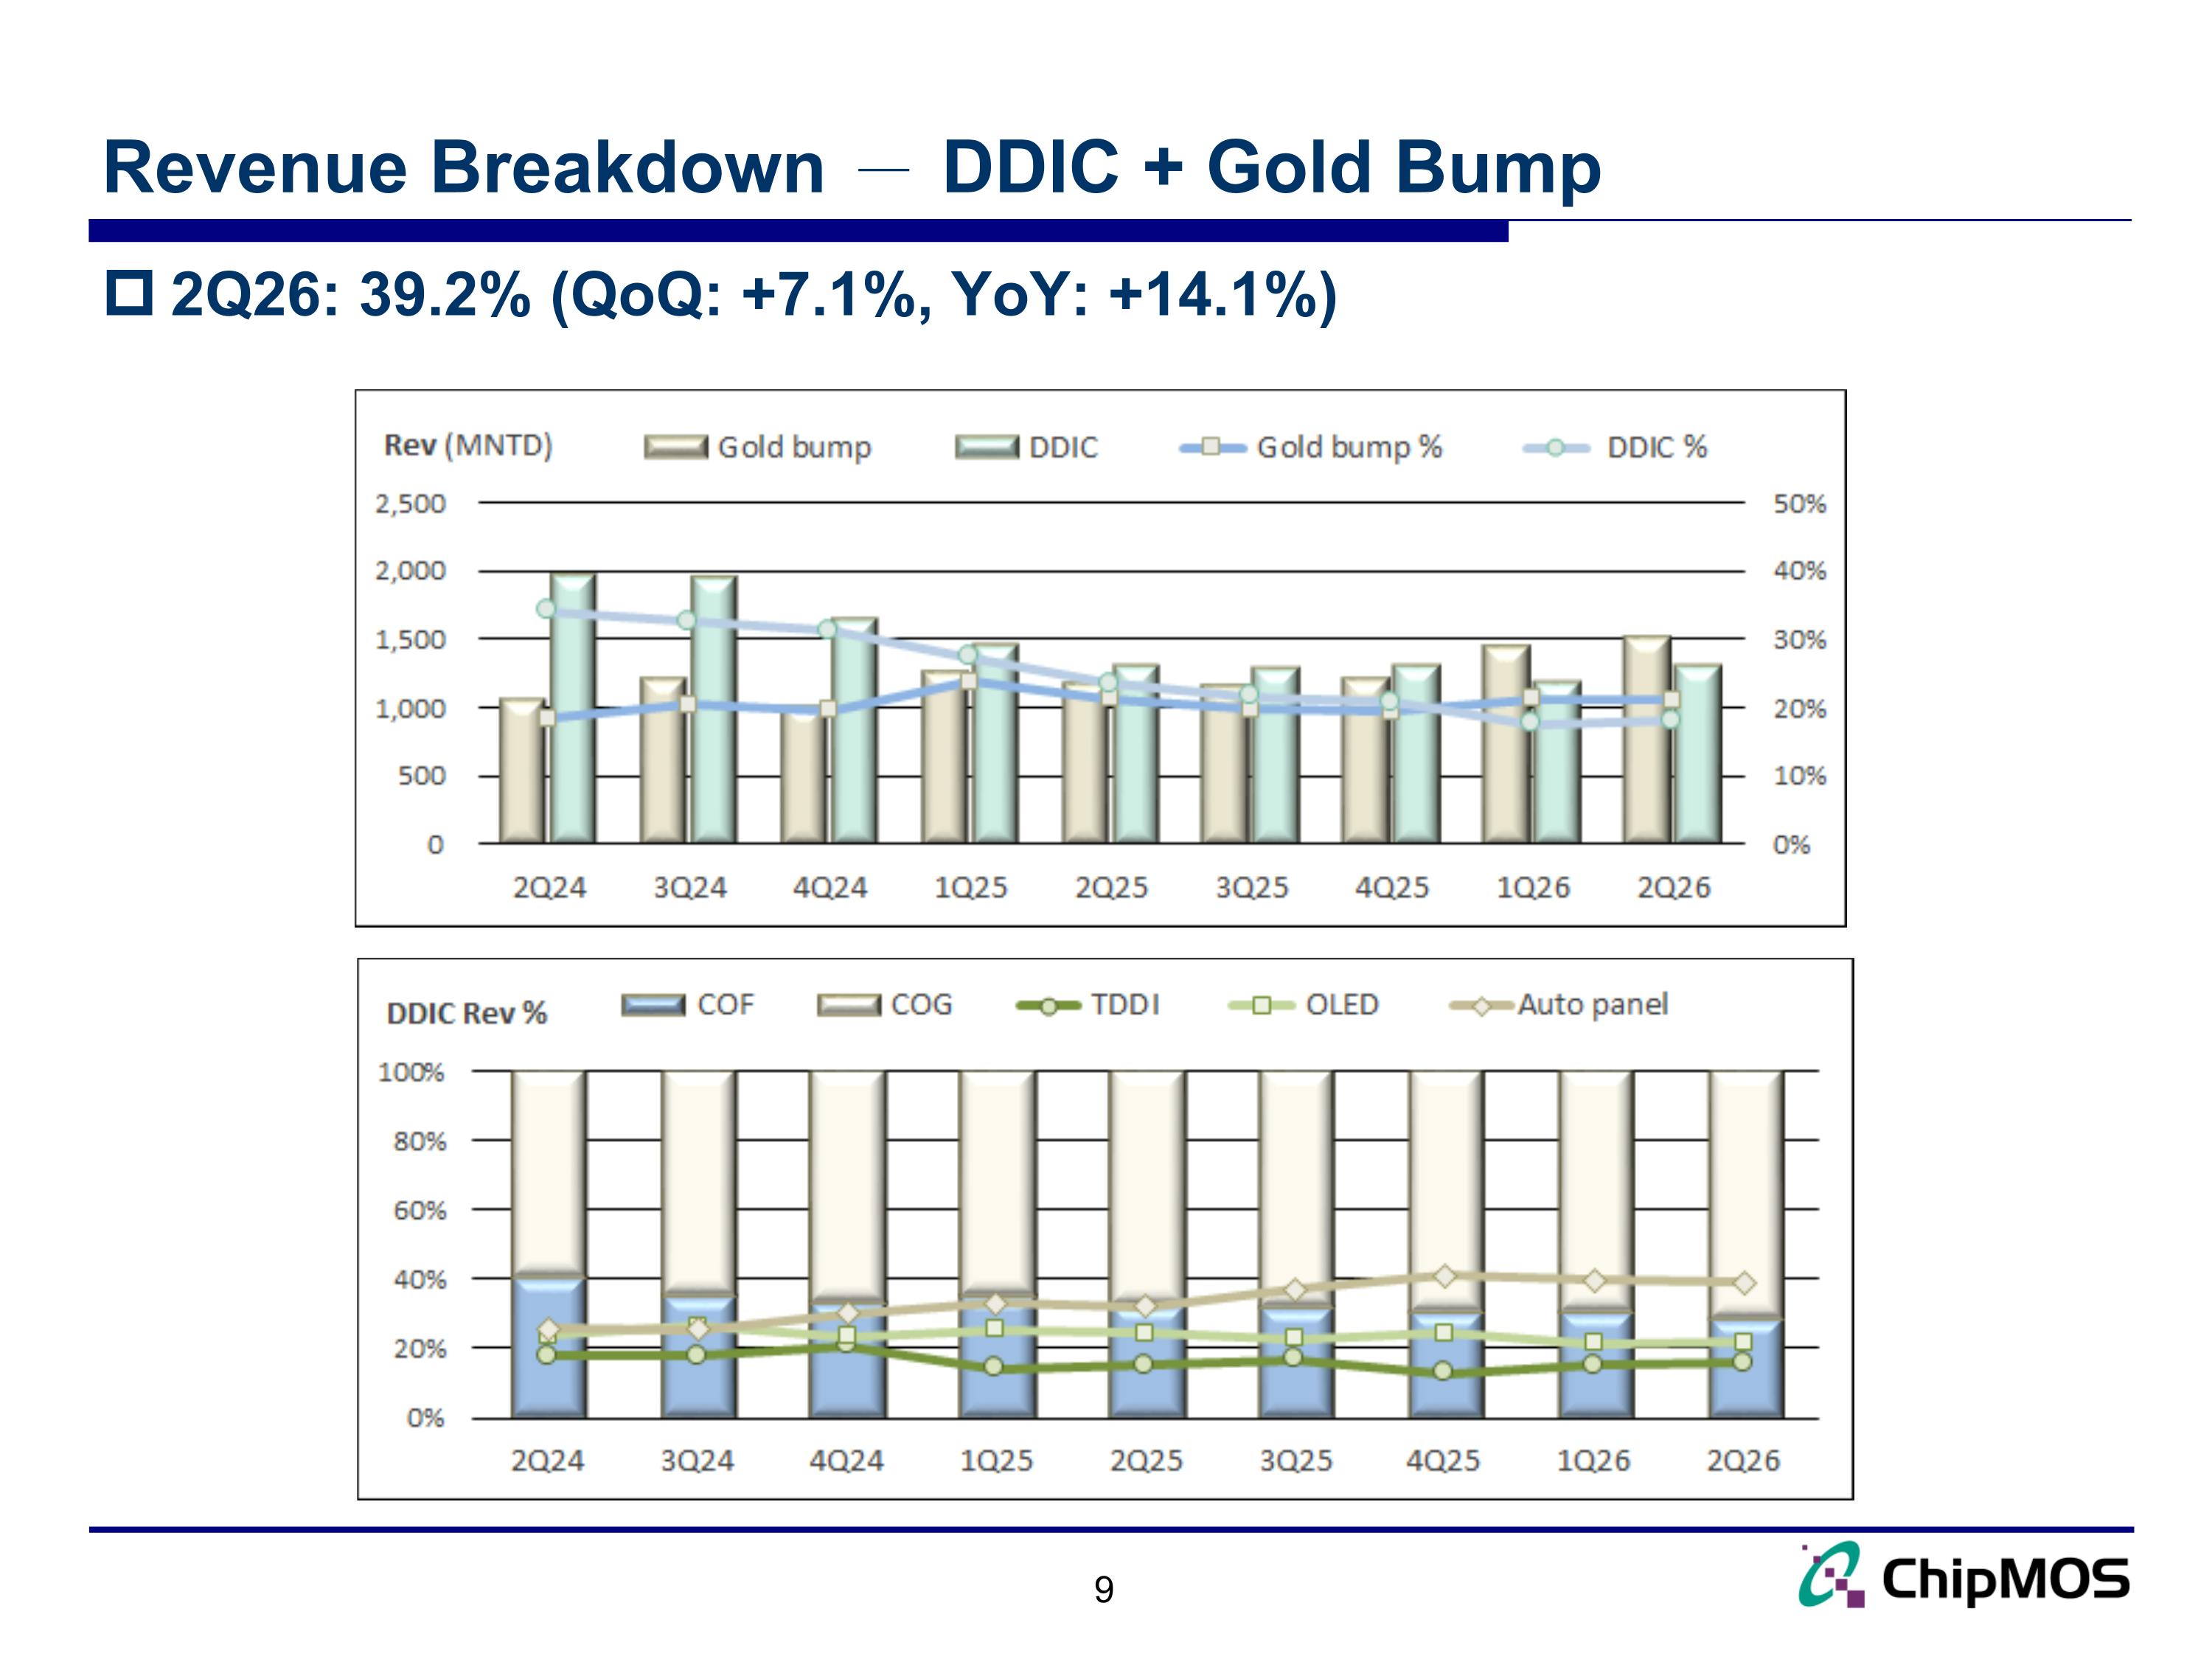
Revenue Breakdown - DDIC + Gold Bump 9 2Q26: 39.2% (QoQ: +7.1%, YoY: +14.1%)
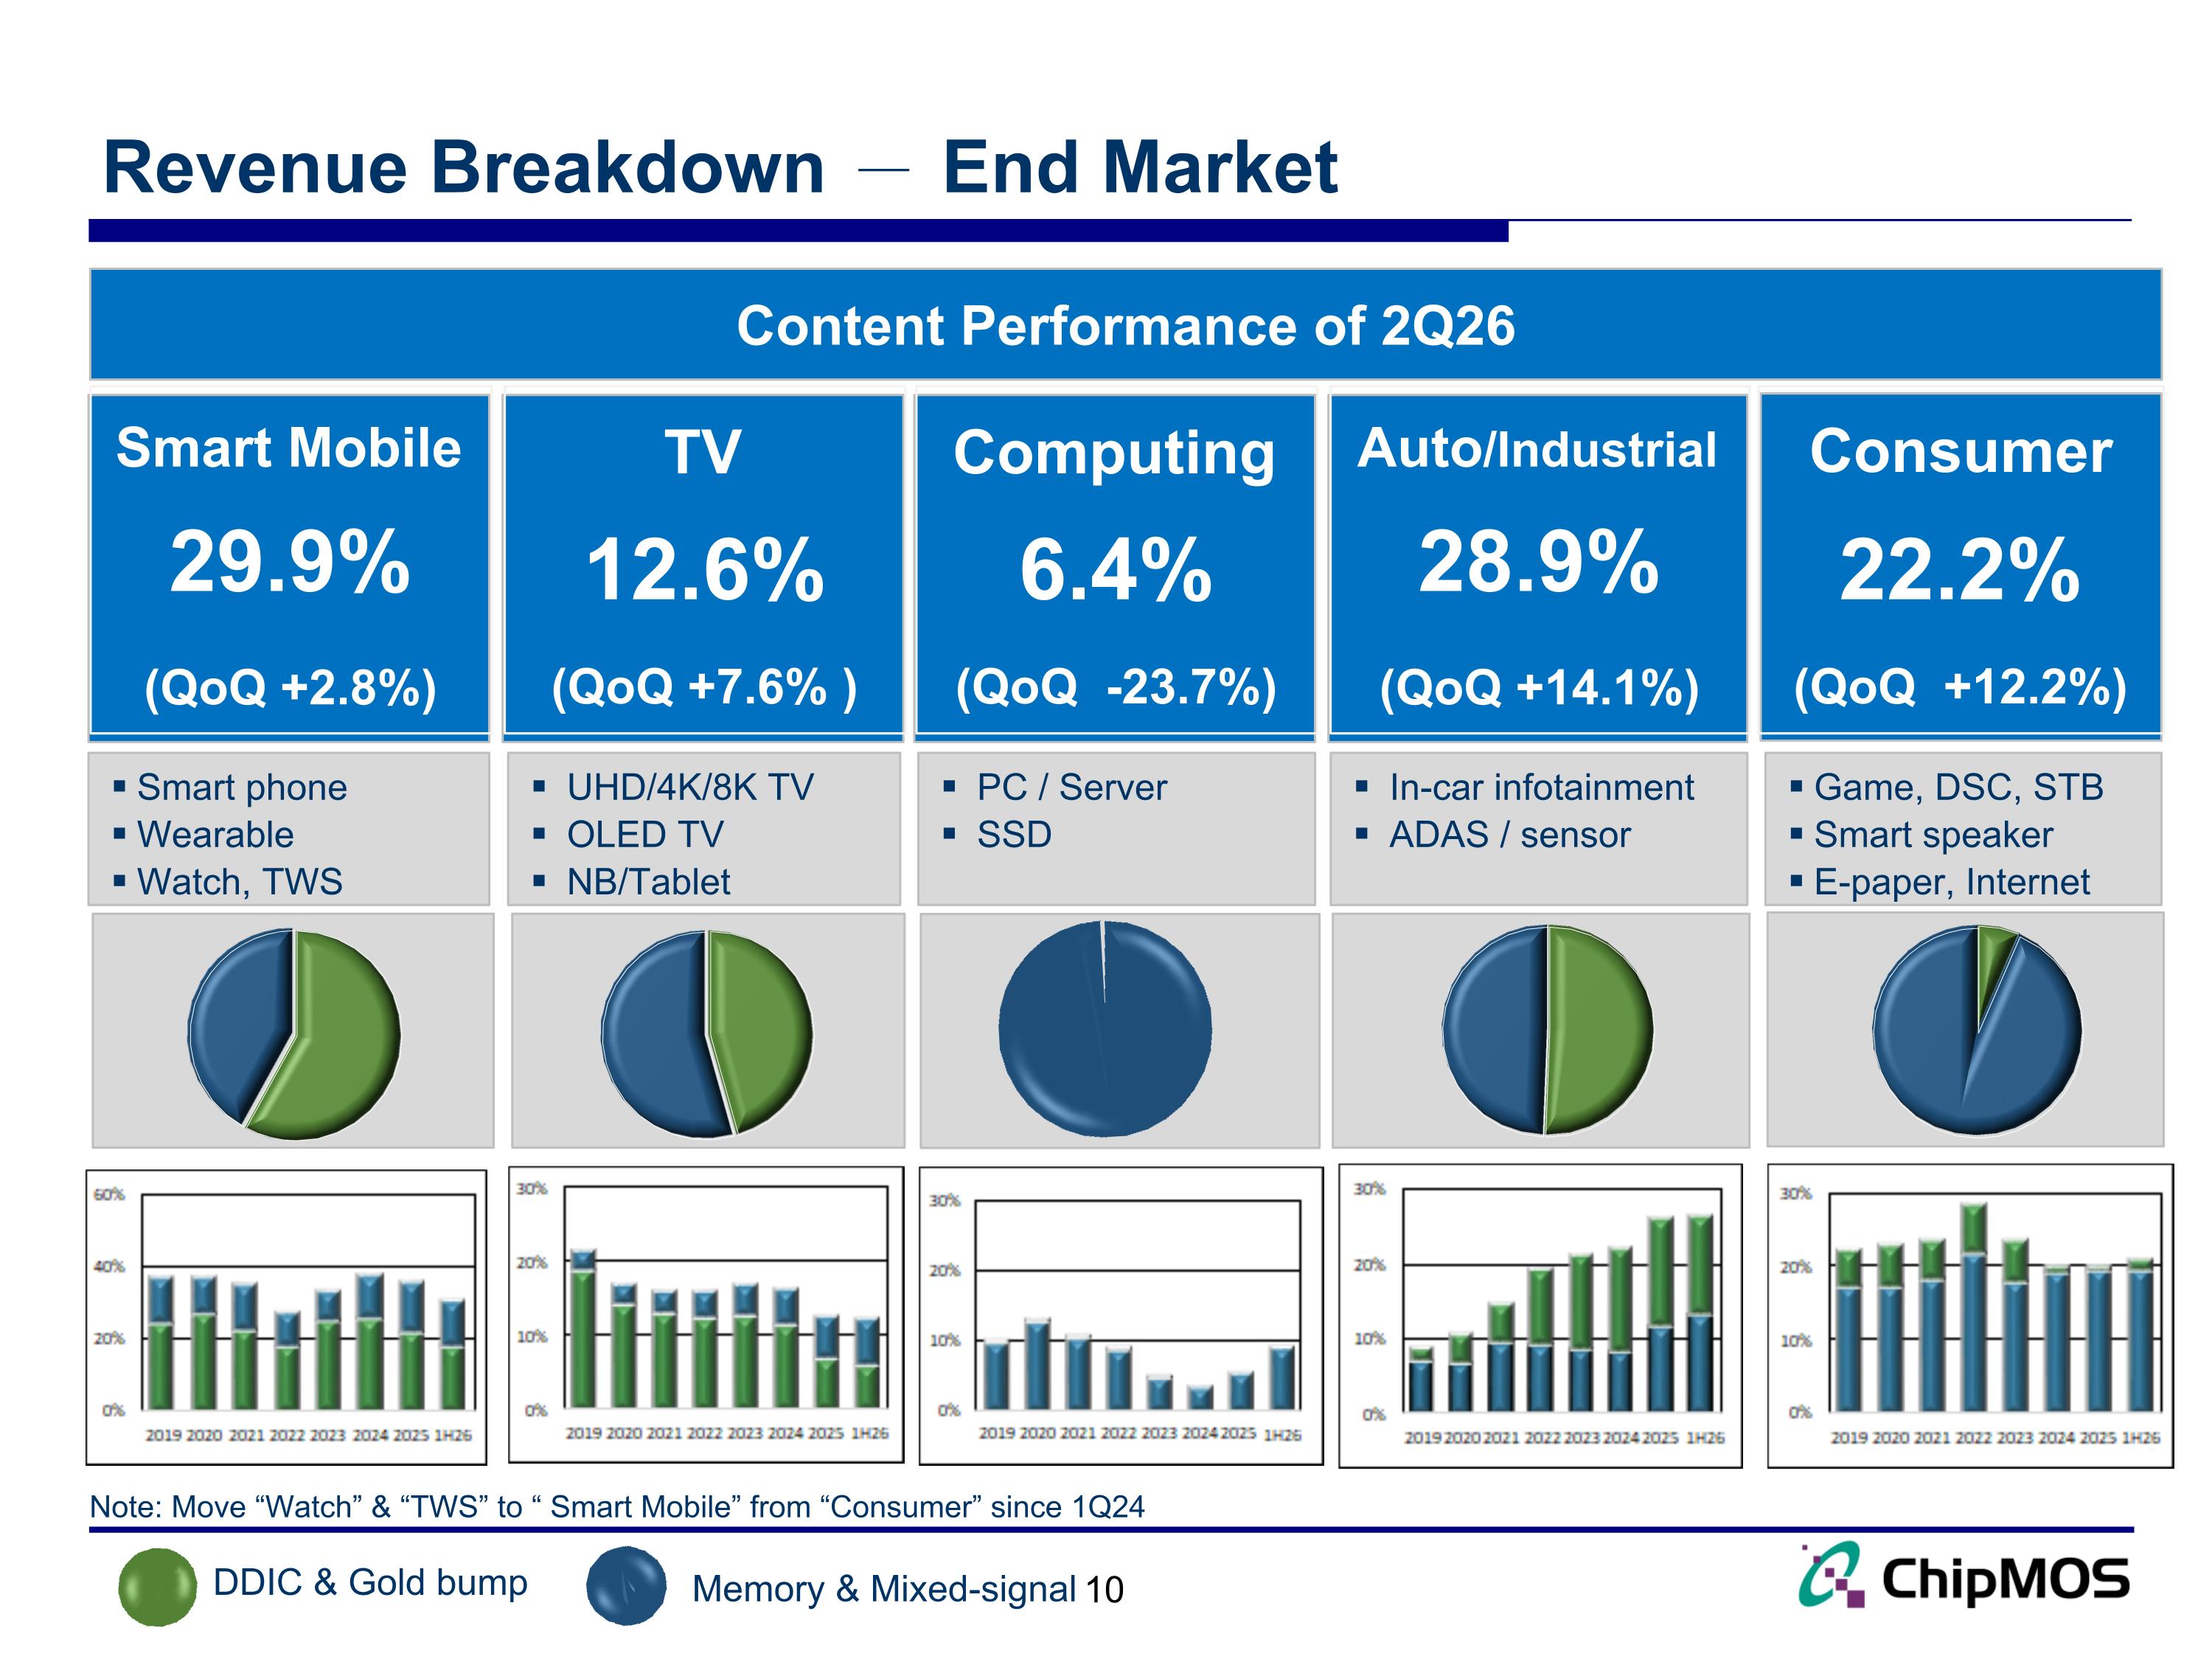
Revenue Breakdown - End Market 10 DDIC & Gold bump Memory & Mixed-signal Content Performance of 2Q26 Smart Mobile TV Computing Auto/Industrial Consumer Smart phone Wearable Watch, TWS UHD/4K/8K TV OLED TV NB/Tablet PC / Server SSD In-car infotainment ADAS / sensor Game, DSC, STB Smart speaker E-paper, Internet Note: Move “Watch” & “TWS” to “ Smart Mobile” from “Consumer” since 1Q24 29.9% (QoQ +2.8%) 12.6% (QoQ +7.6% ) 6.4% (QoQ -23.7%) 28.9% (QoQ +14.1%) 22.2% (QoQ +12.2%)
11 2Q26 Financial Results
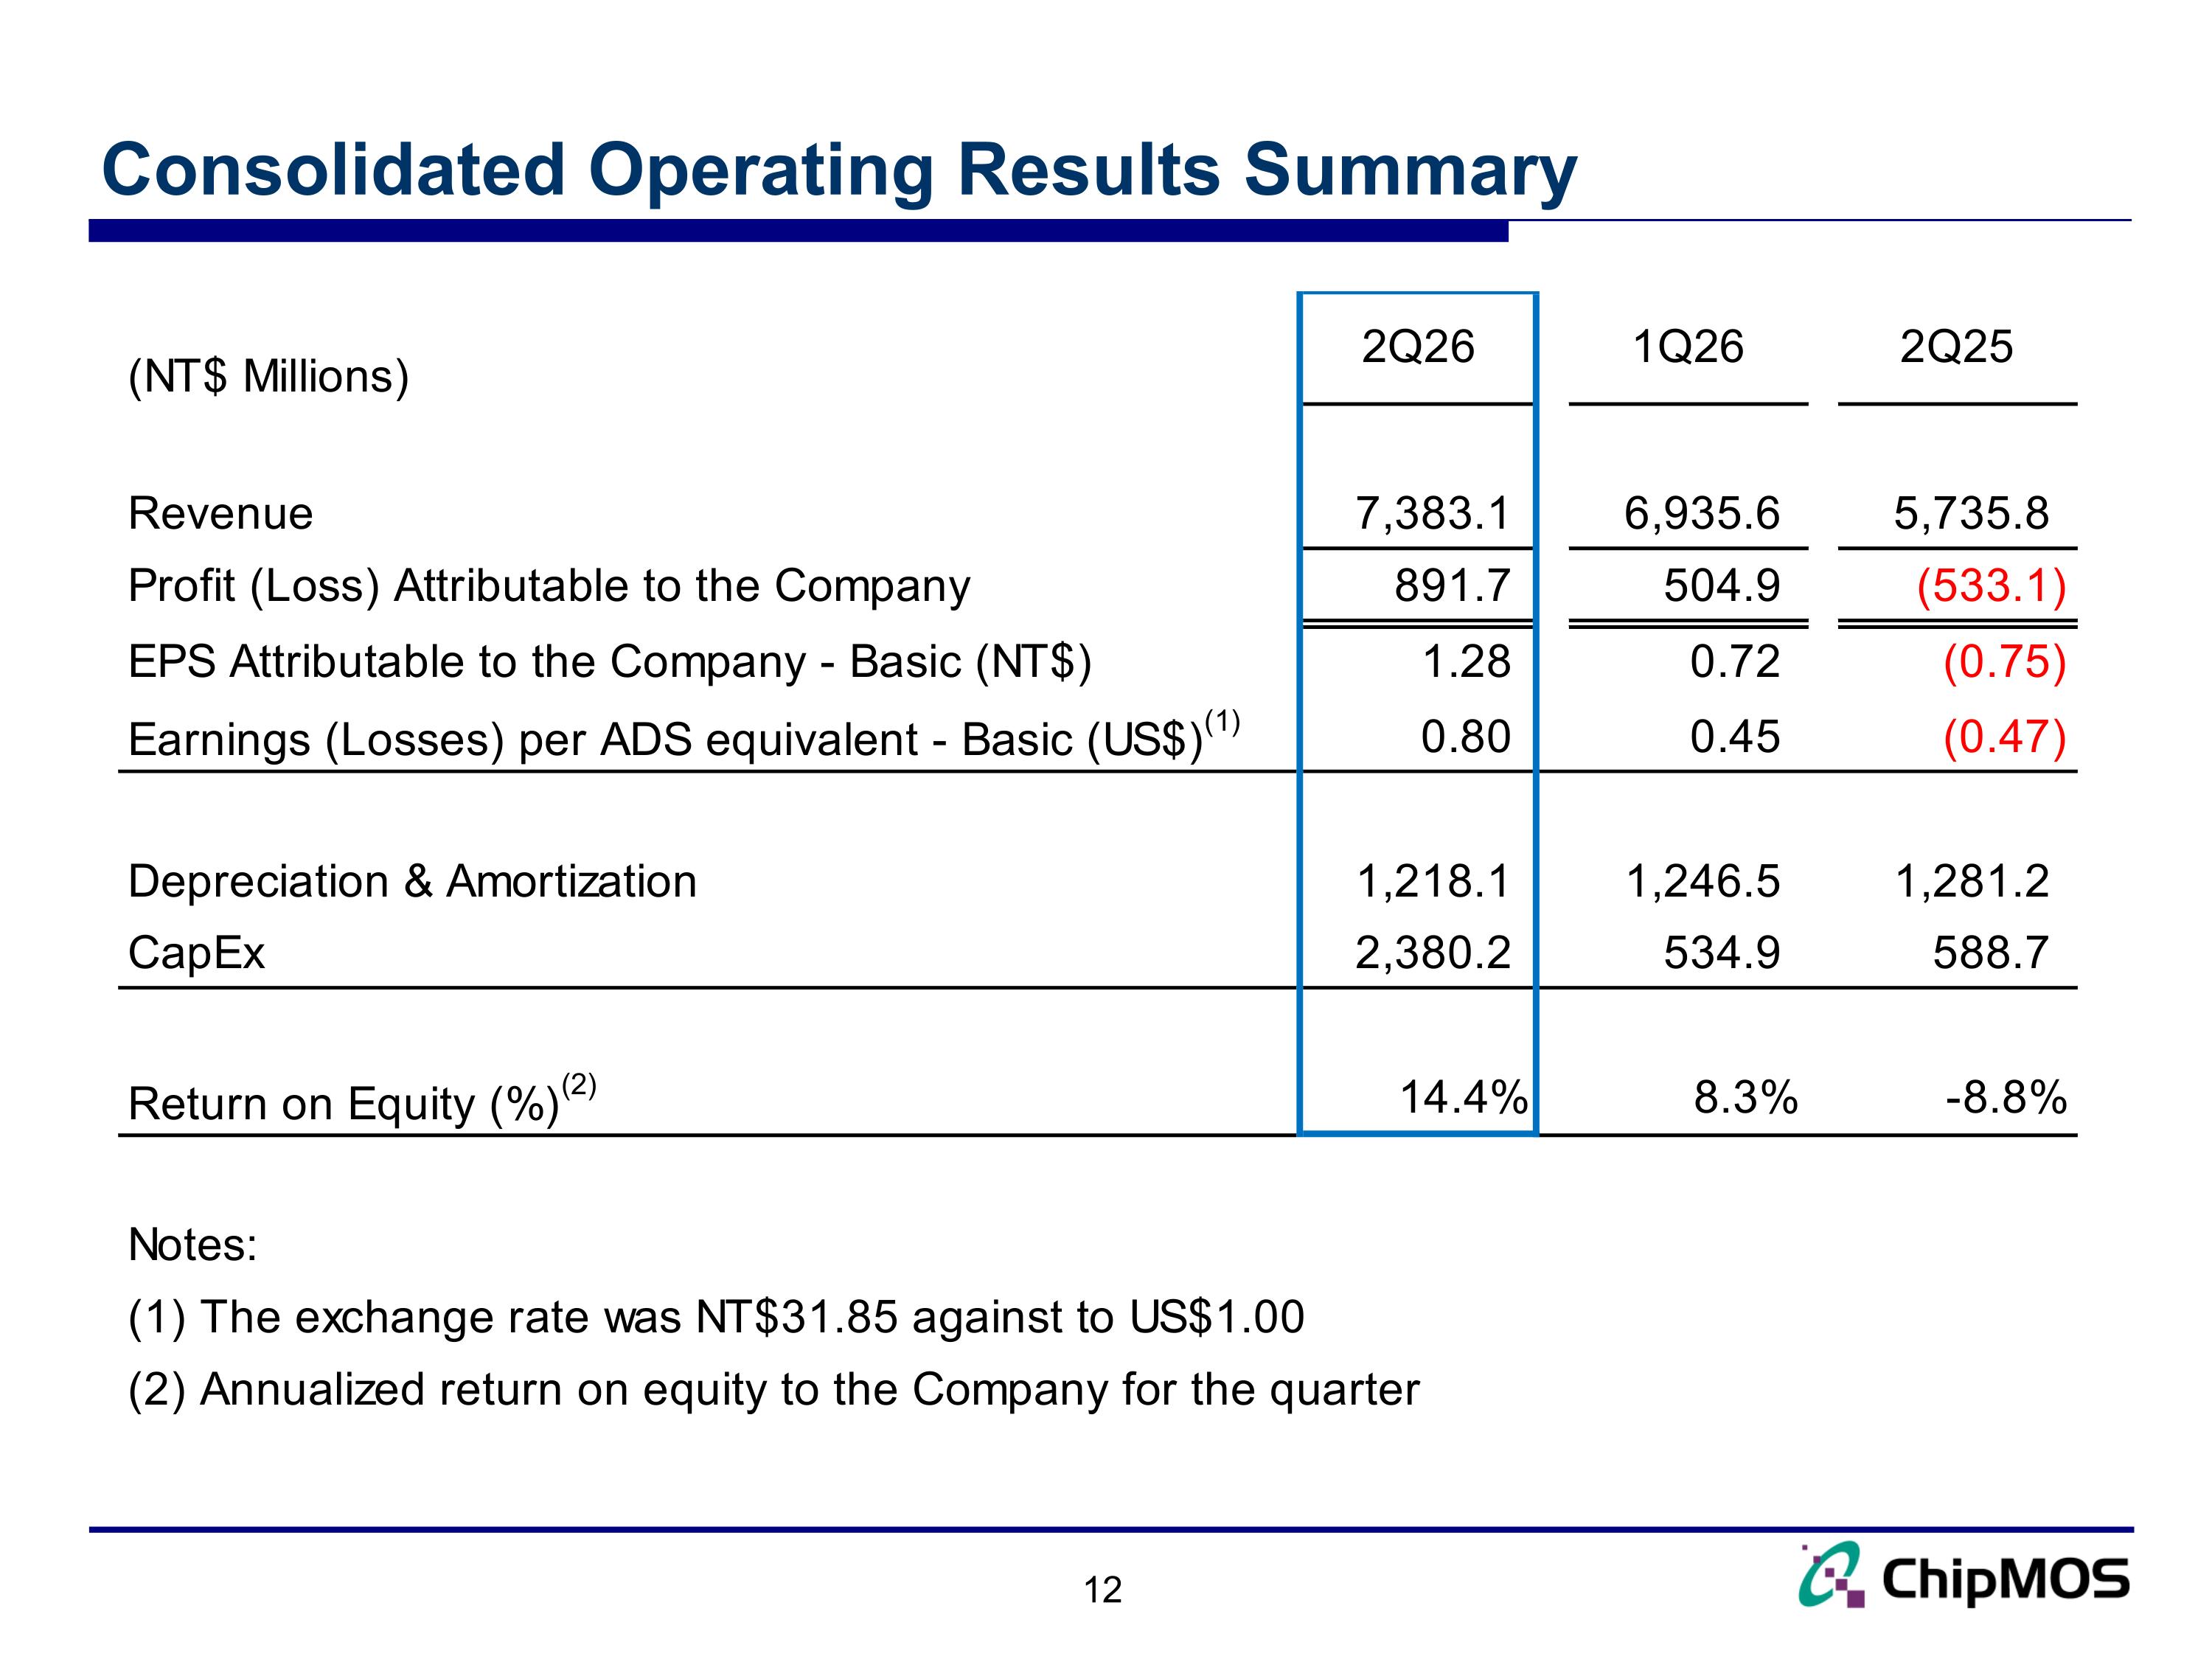
Consolidated Operating Results Summary
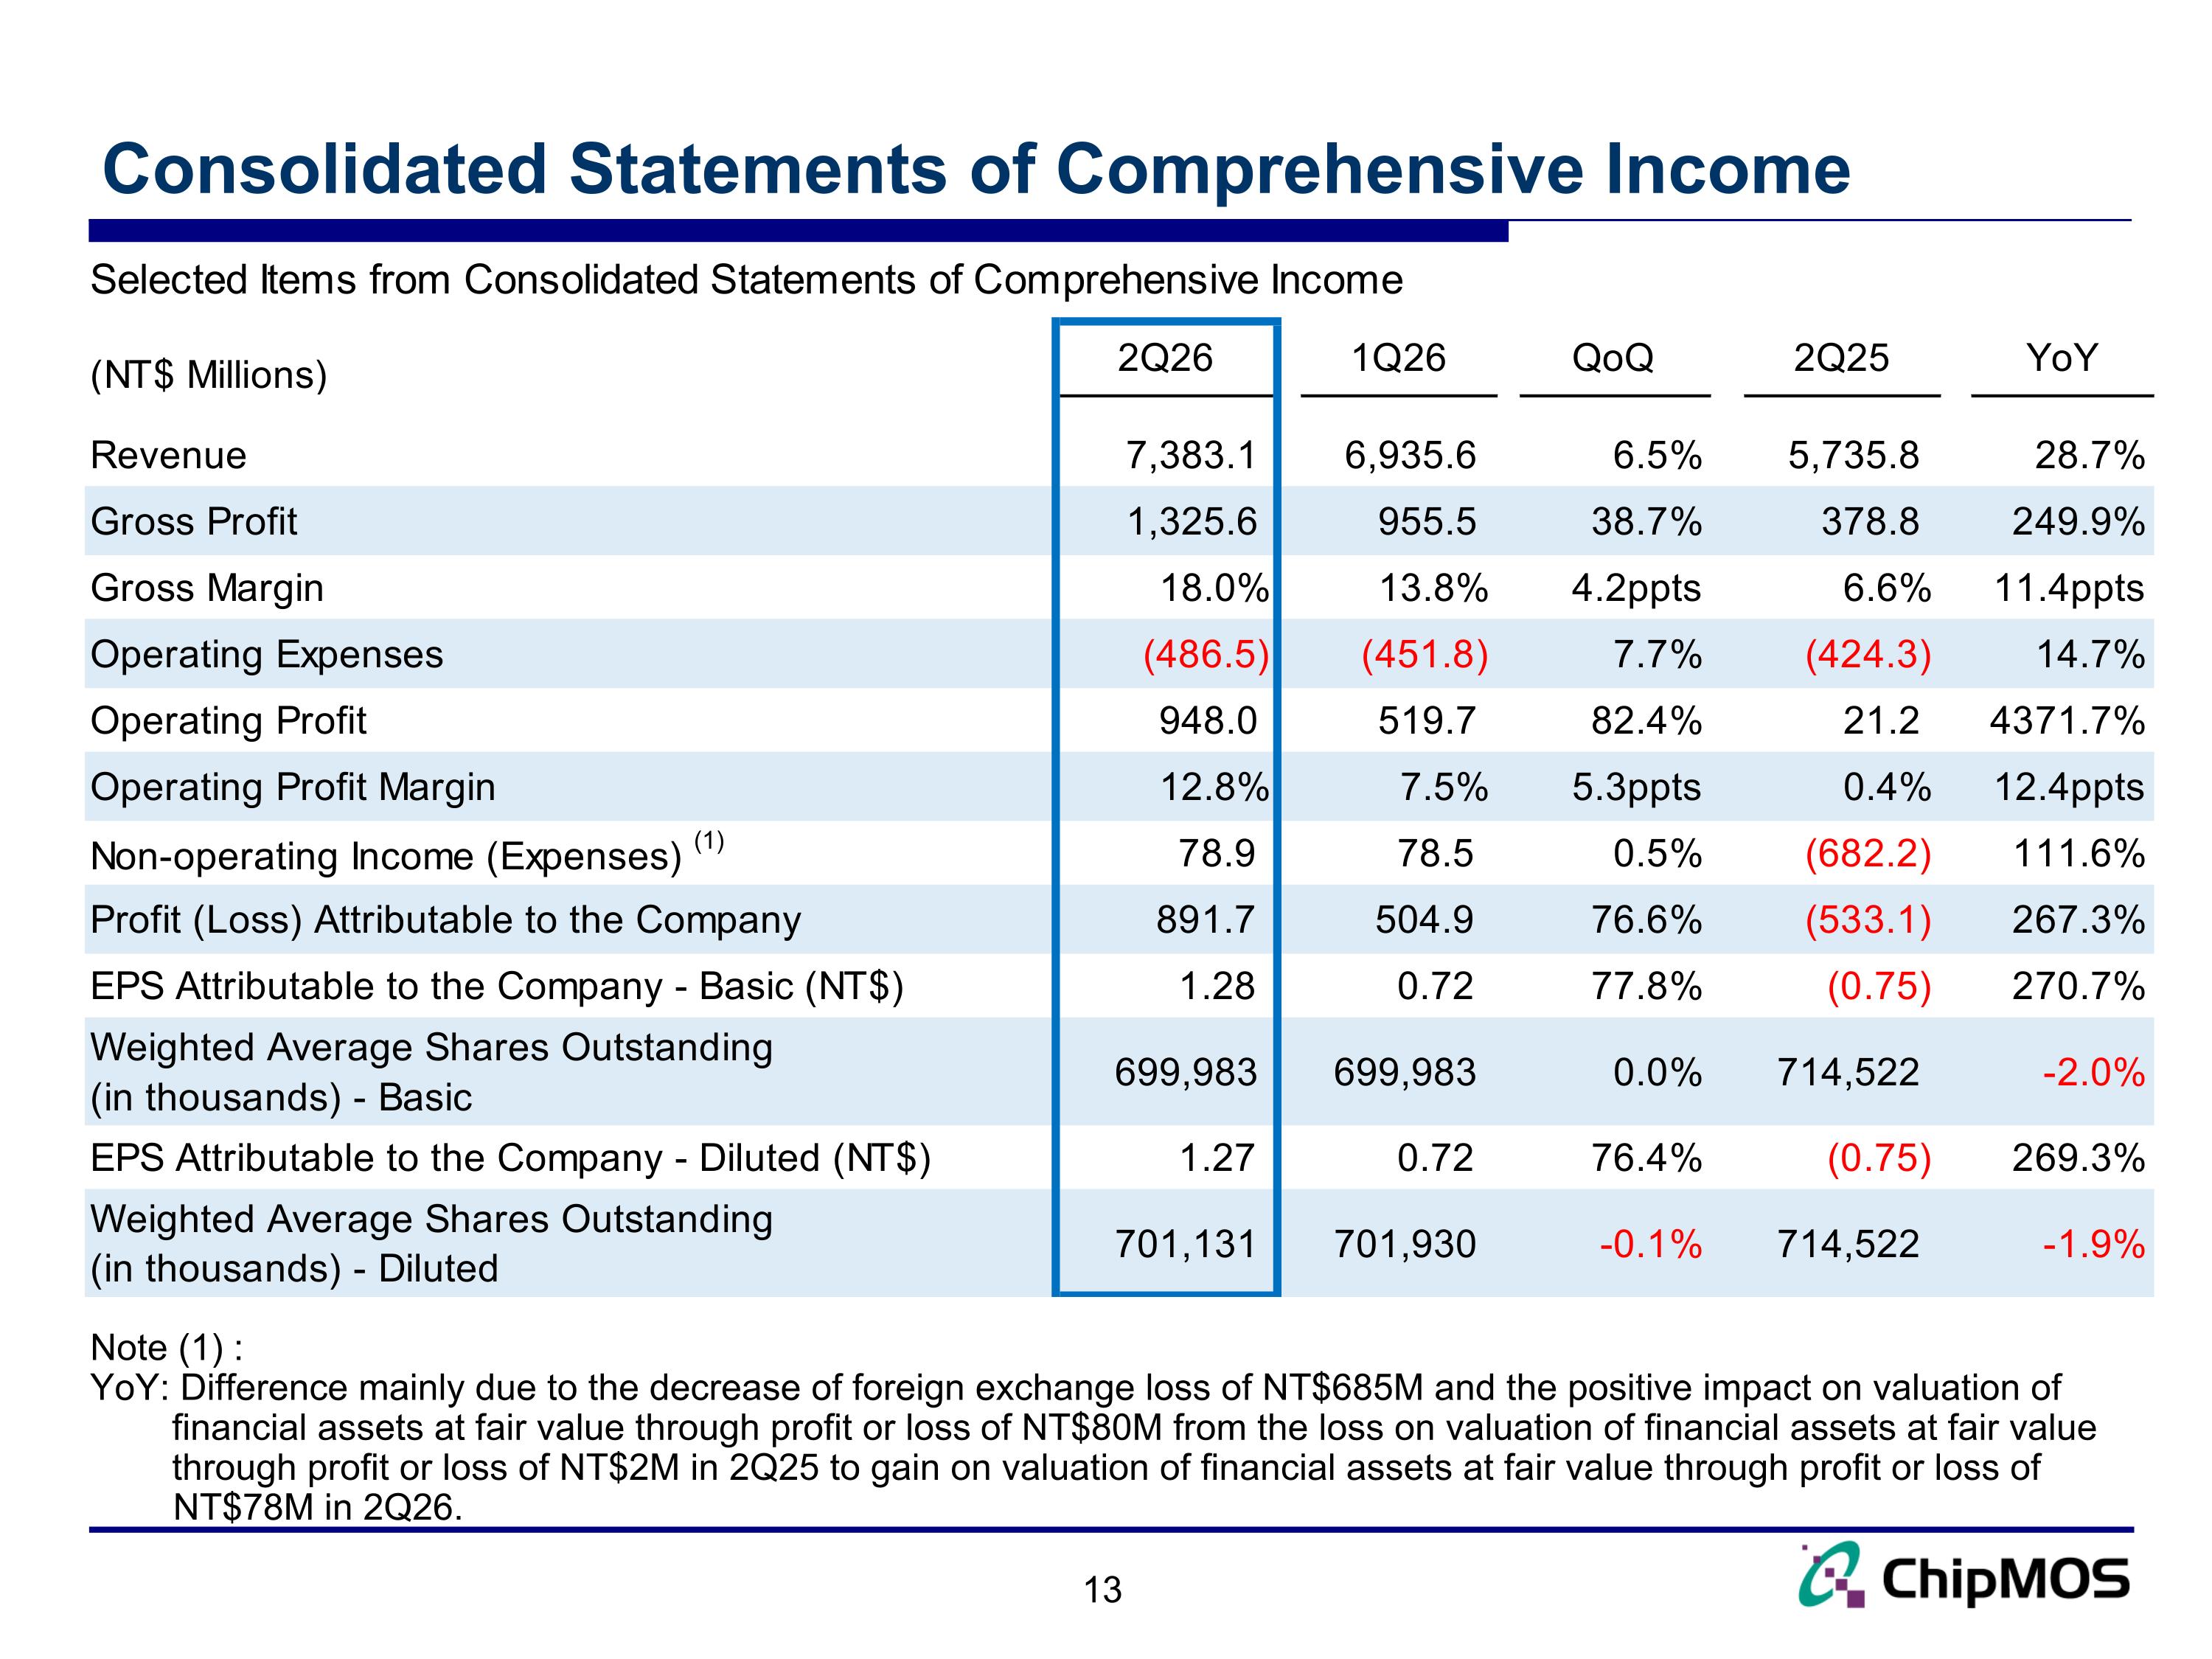
Consolidated Statements of Comprehensive Income Note (1) : YoY: Difference mainly due to the decrease of foreign exchange loss of NT$685M and the positive impact on valuation of financial assets at fair value through profit or loss of NT$80M from the loss on valuation of financial assets at fair value through profit or loss of NT$2M in 2Q25 to gain on valuation of financial assets at fair value through profit or loss of NT$78M in 2Q26.
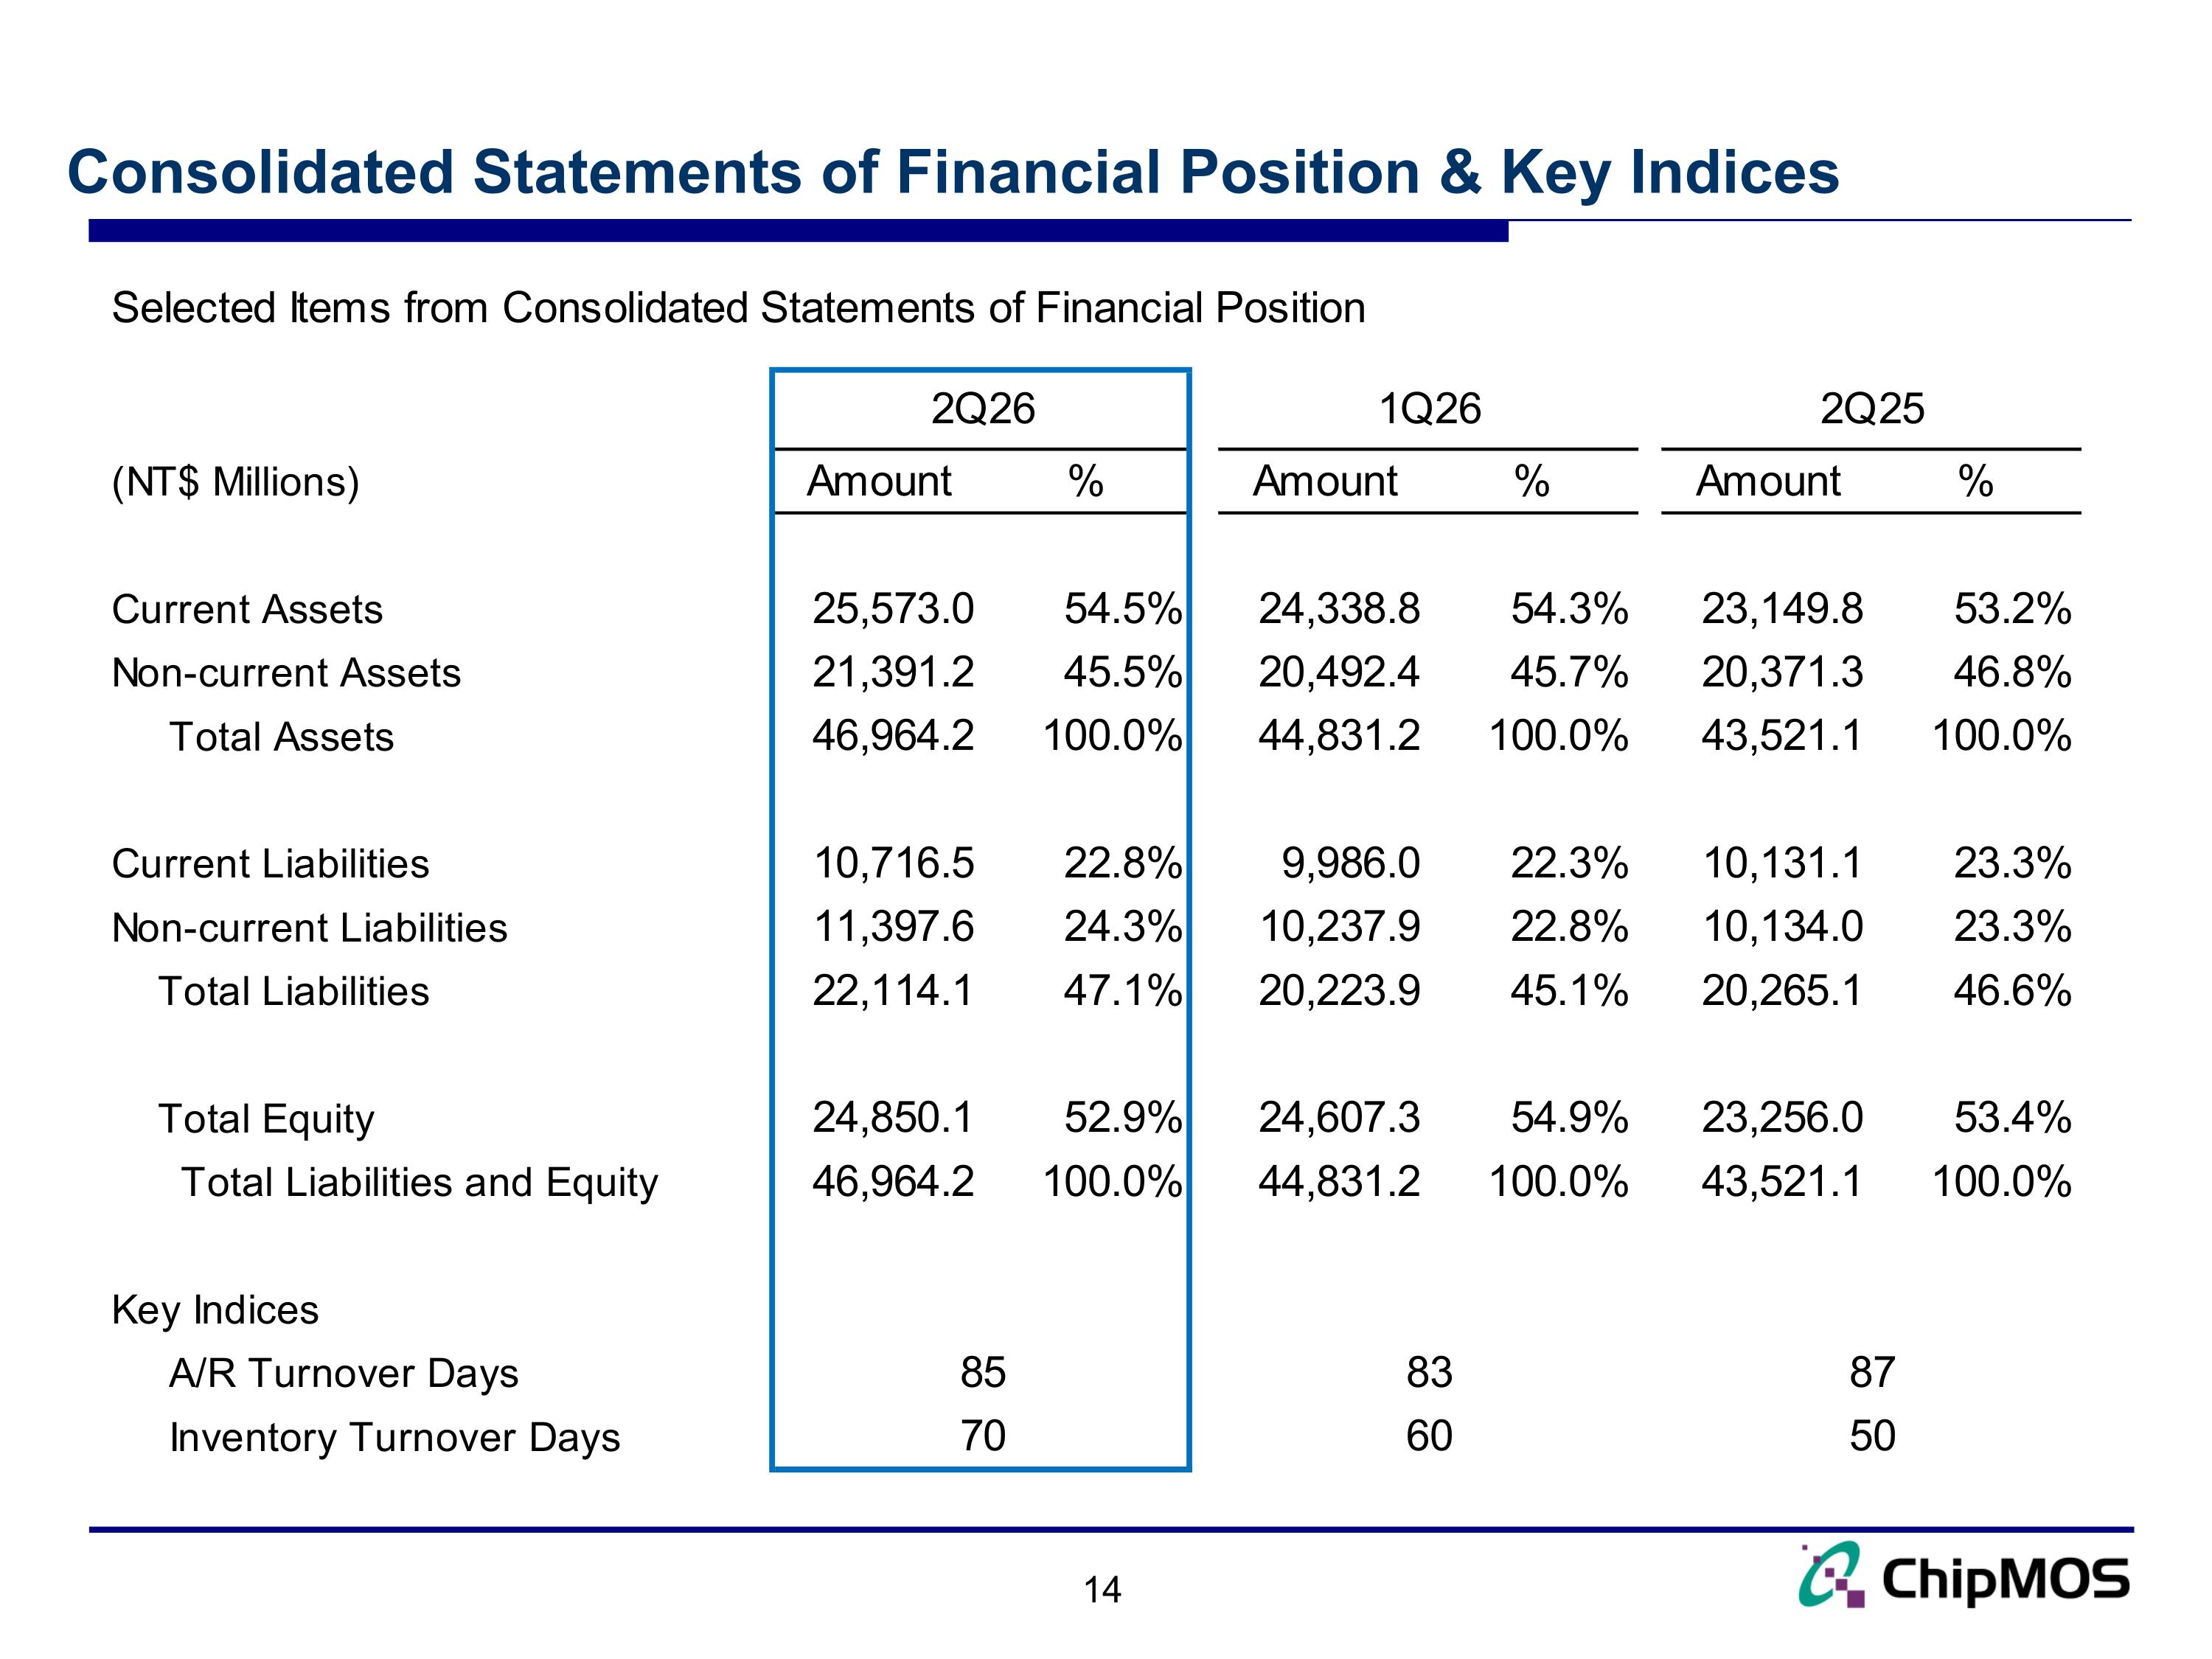
Consolidated Statements of Financial Position & Key Indices
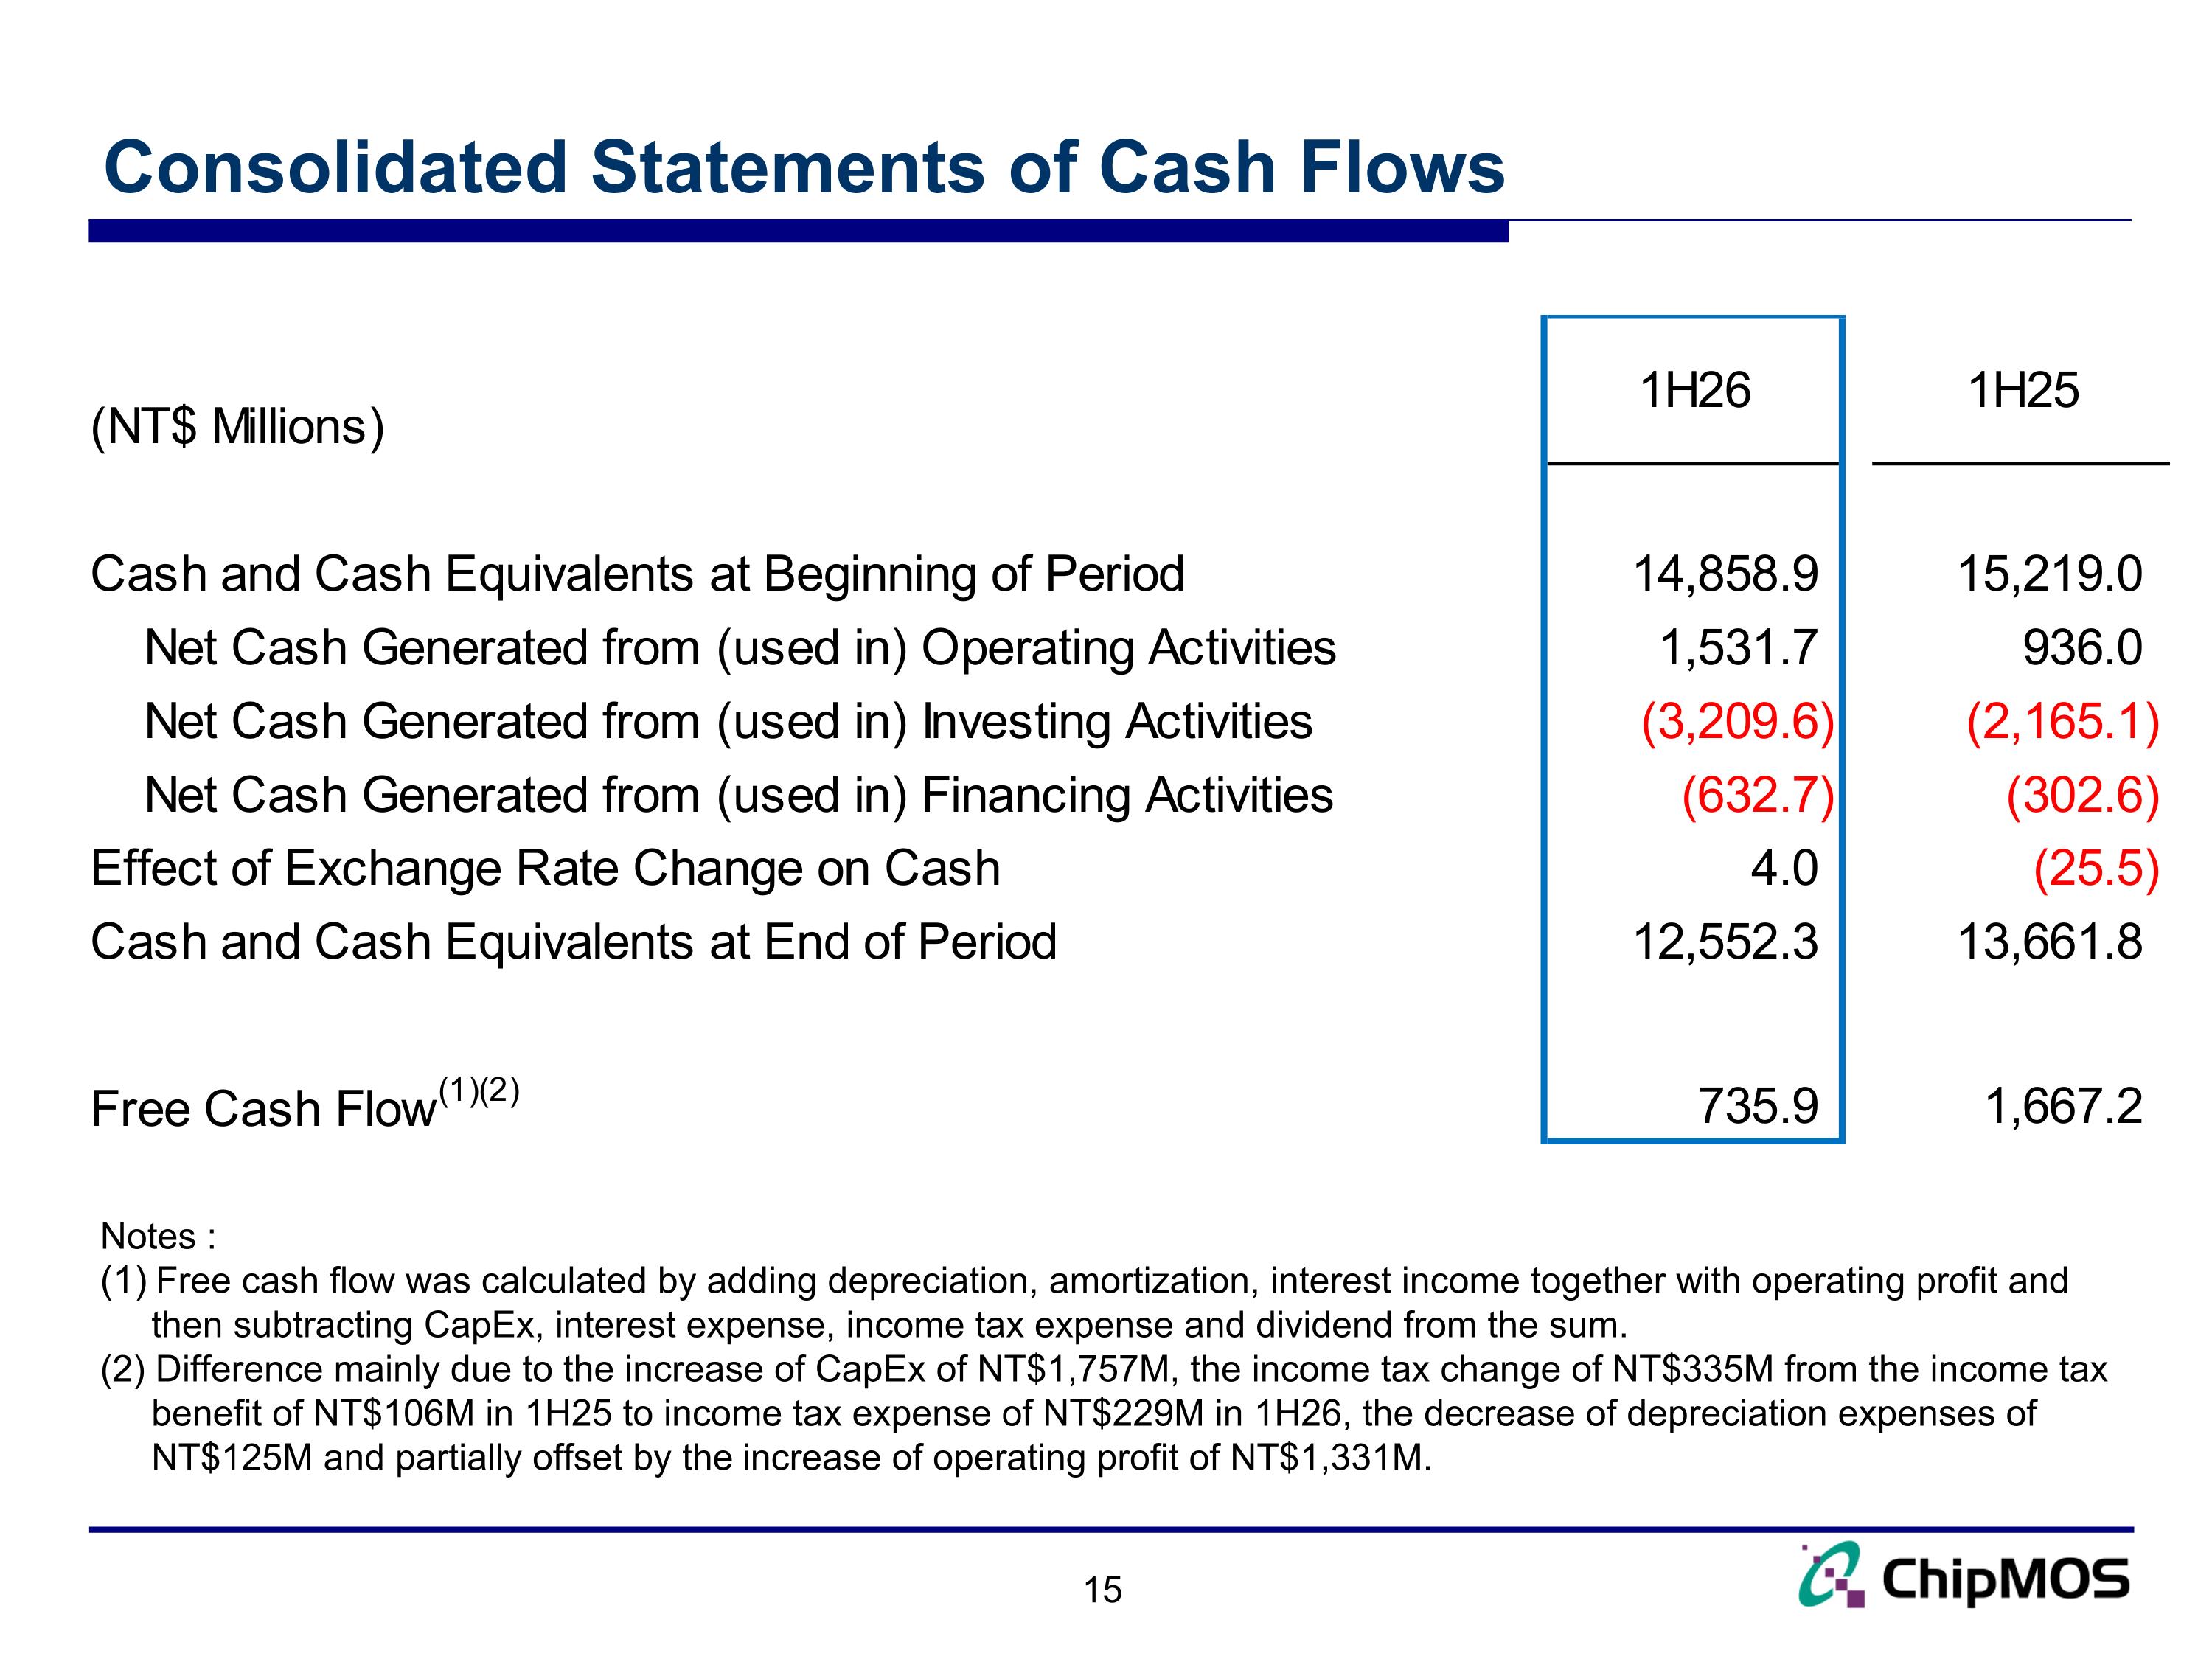
Consolidated Statements of Cash Flows Notes : Free cash flow was calculated by adding depreciation, amortization, interest income together with operating profit and then subtracting CapEx, interest expense, income tax expense and dividend from the sum. (2) Difference mainly due to the increase of CapEx of NT$1,757M, the income tax change of NT$335M from the income tax benefit of NT$106M in 1H25 to income tax expense of NT$229M in 1H26, the decrease of depreciation expenses of NT$125M and partially offset by the increase of operating profit of NT$1,331M.
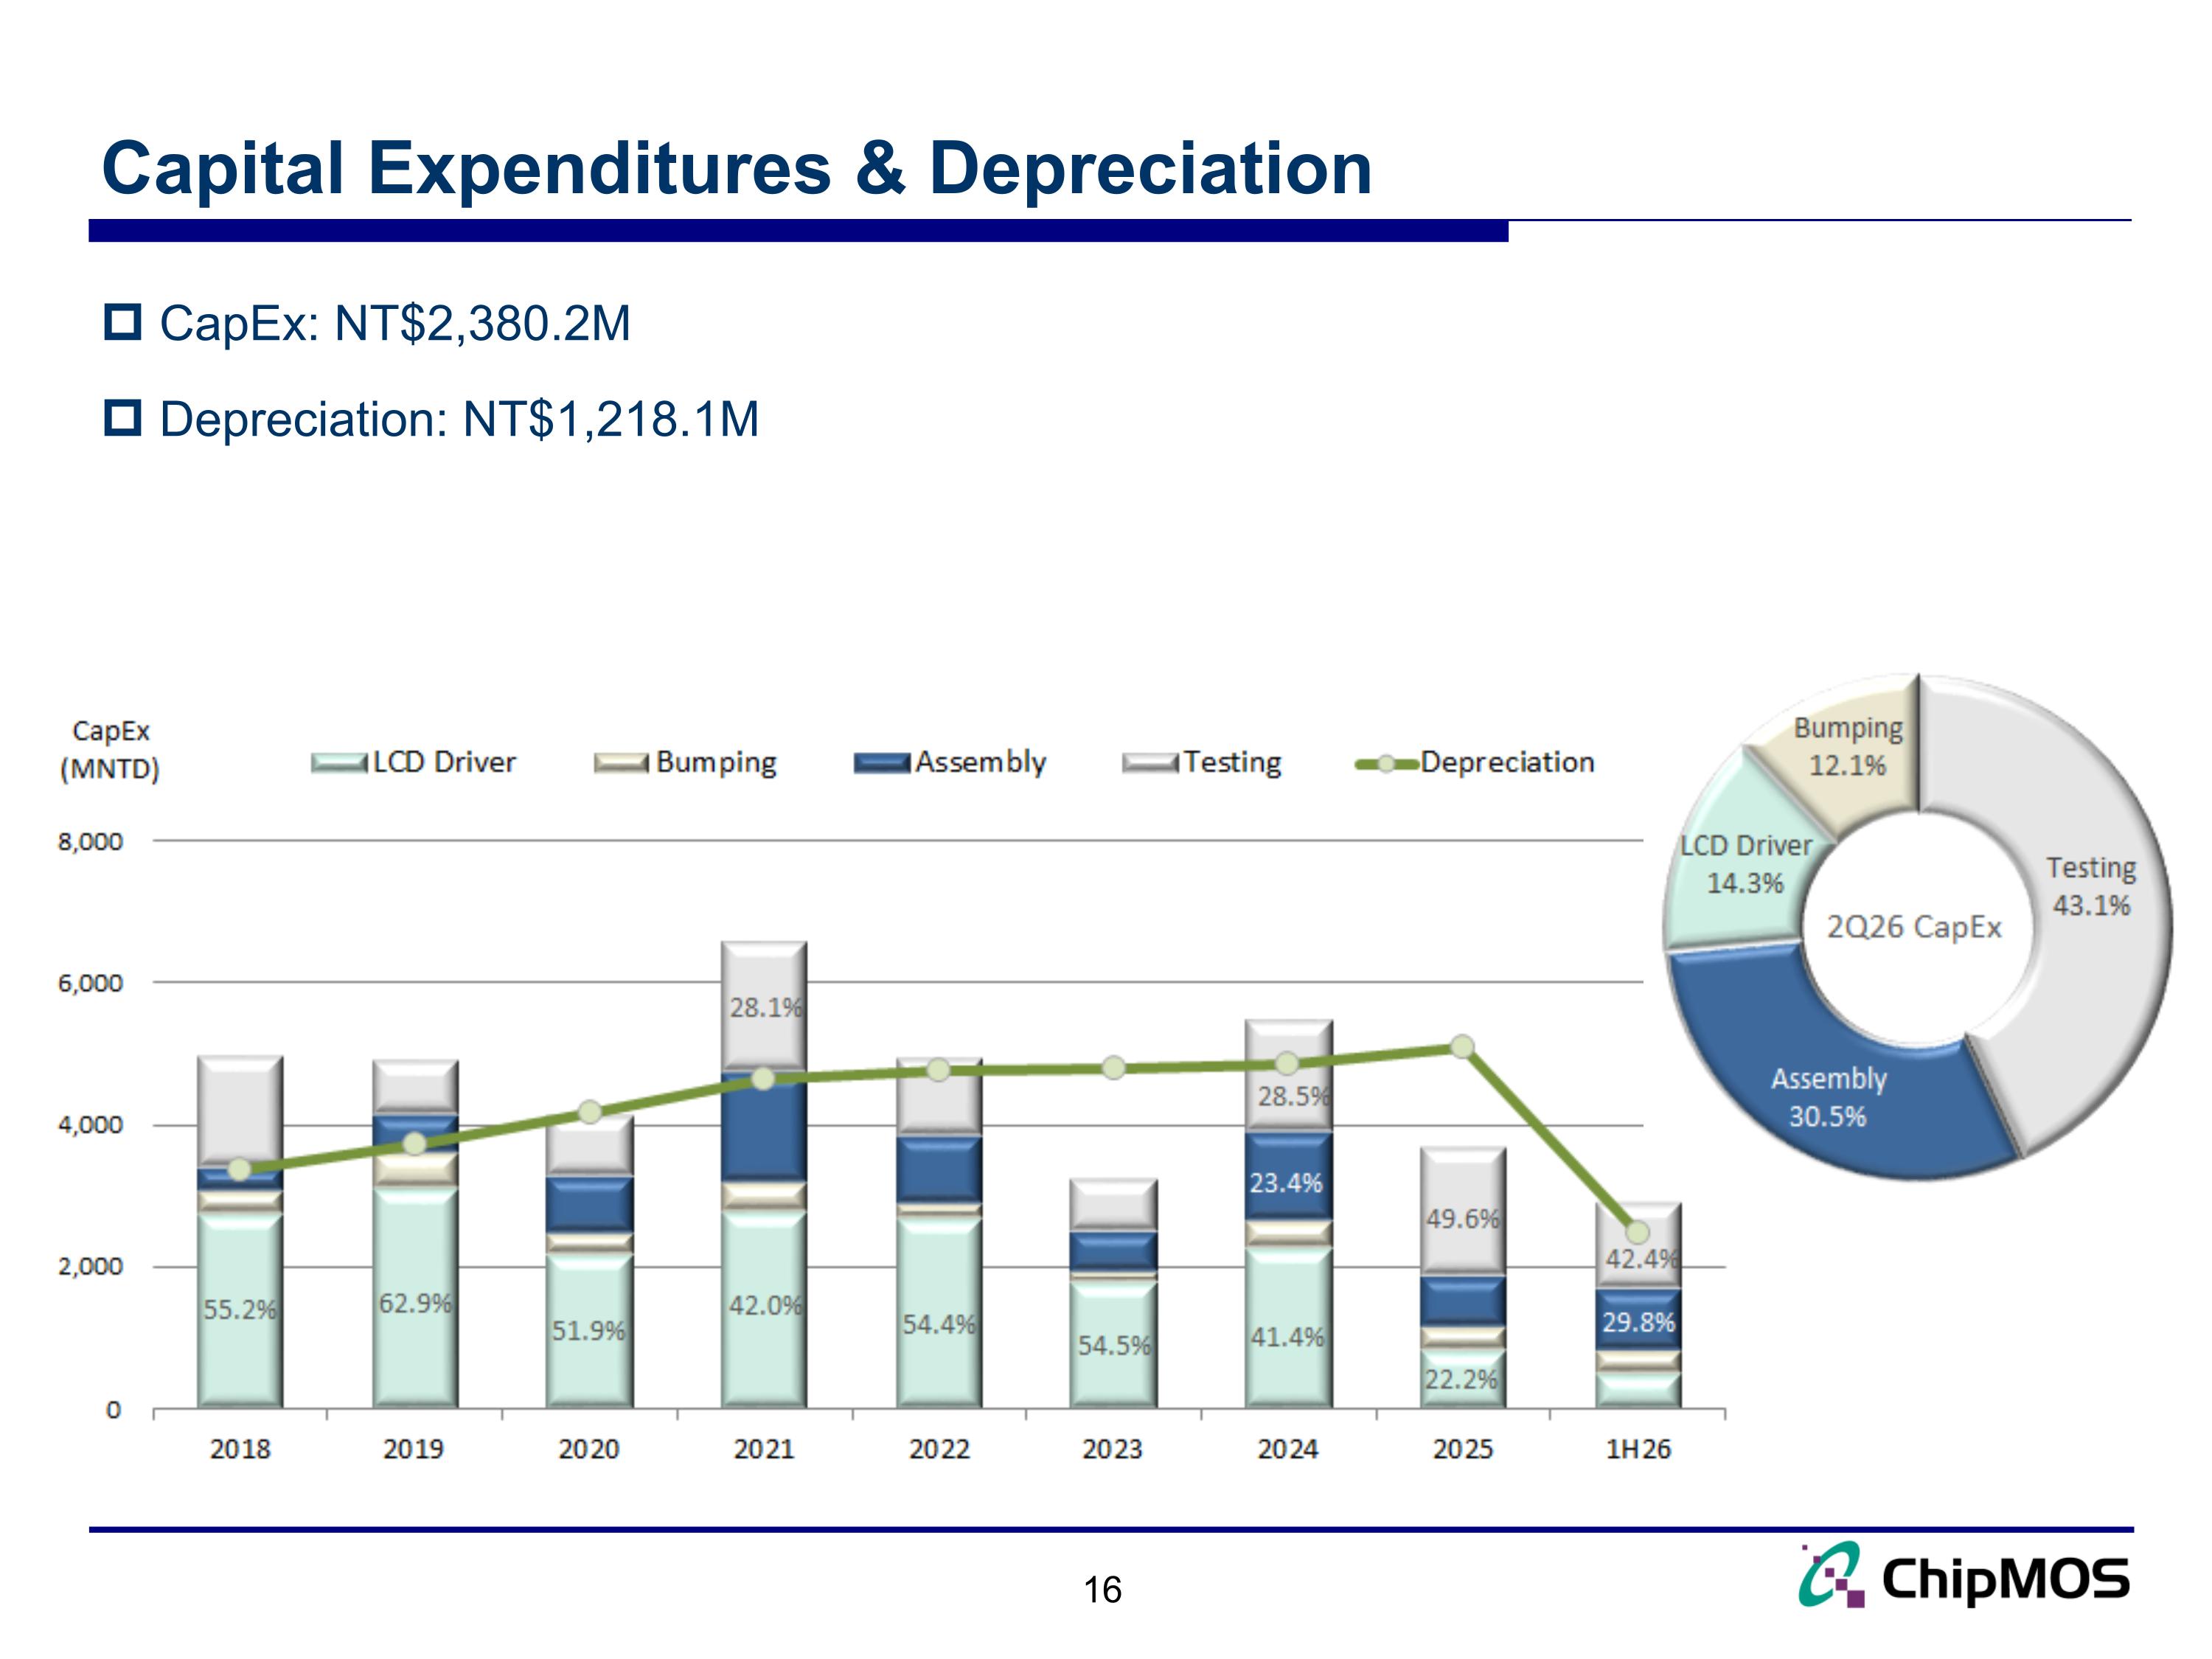
Capital Expenditures & Depreciation 16 CapEx: NT$2,380.2M Depreciation: NT$1,218.1M
17 Business Outlook
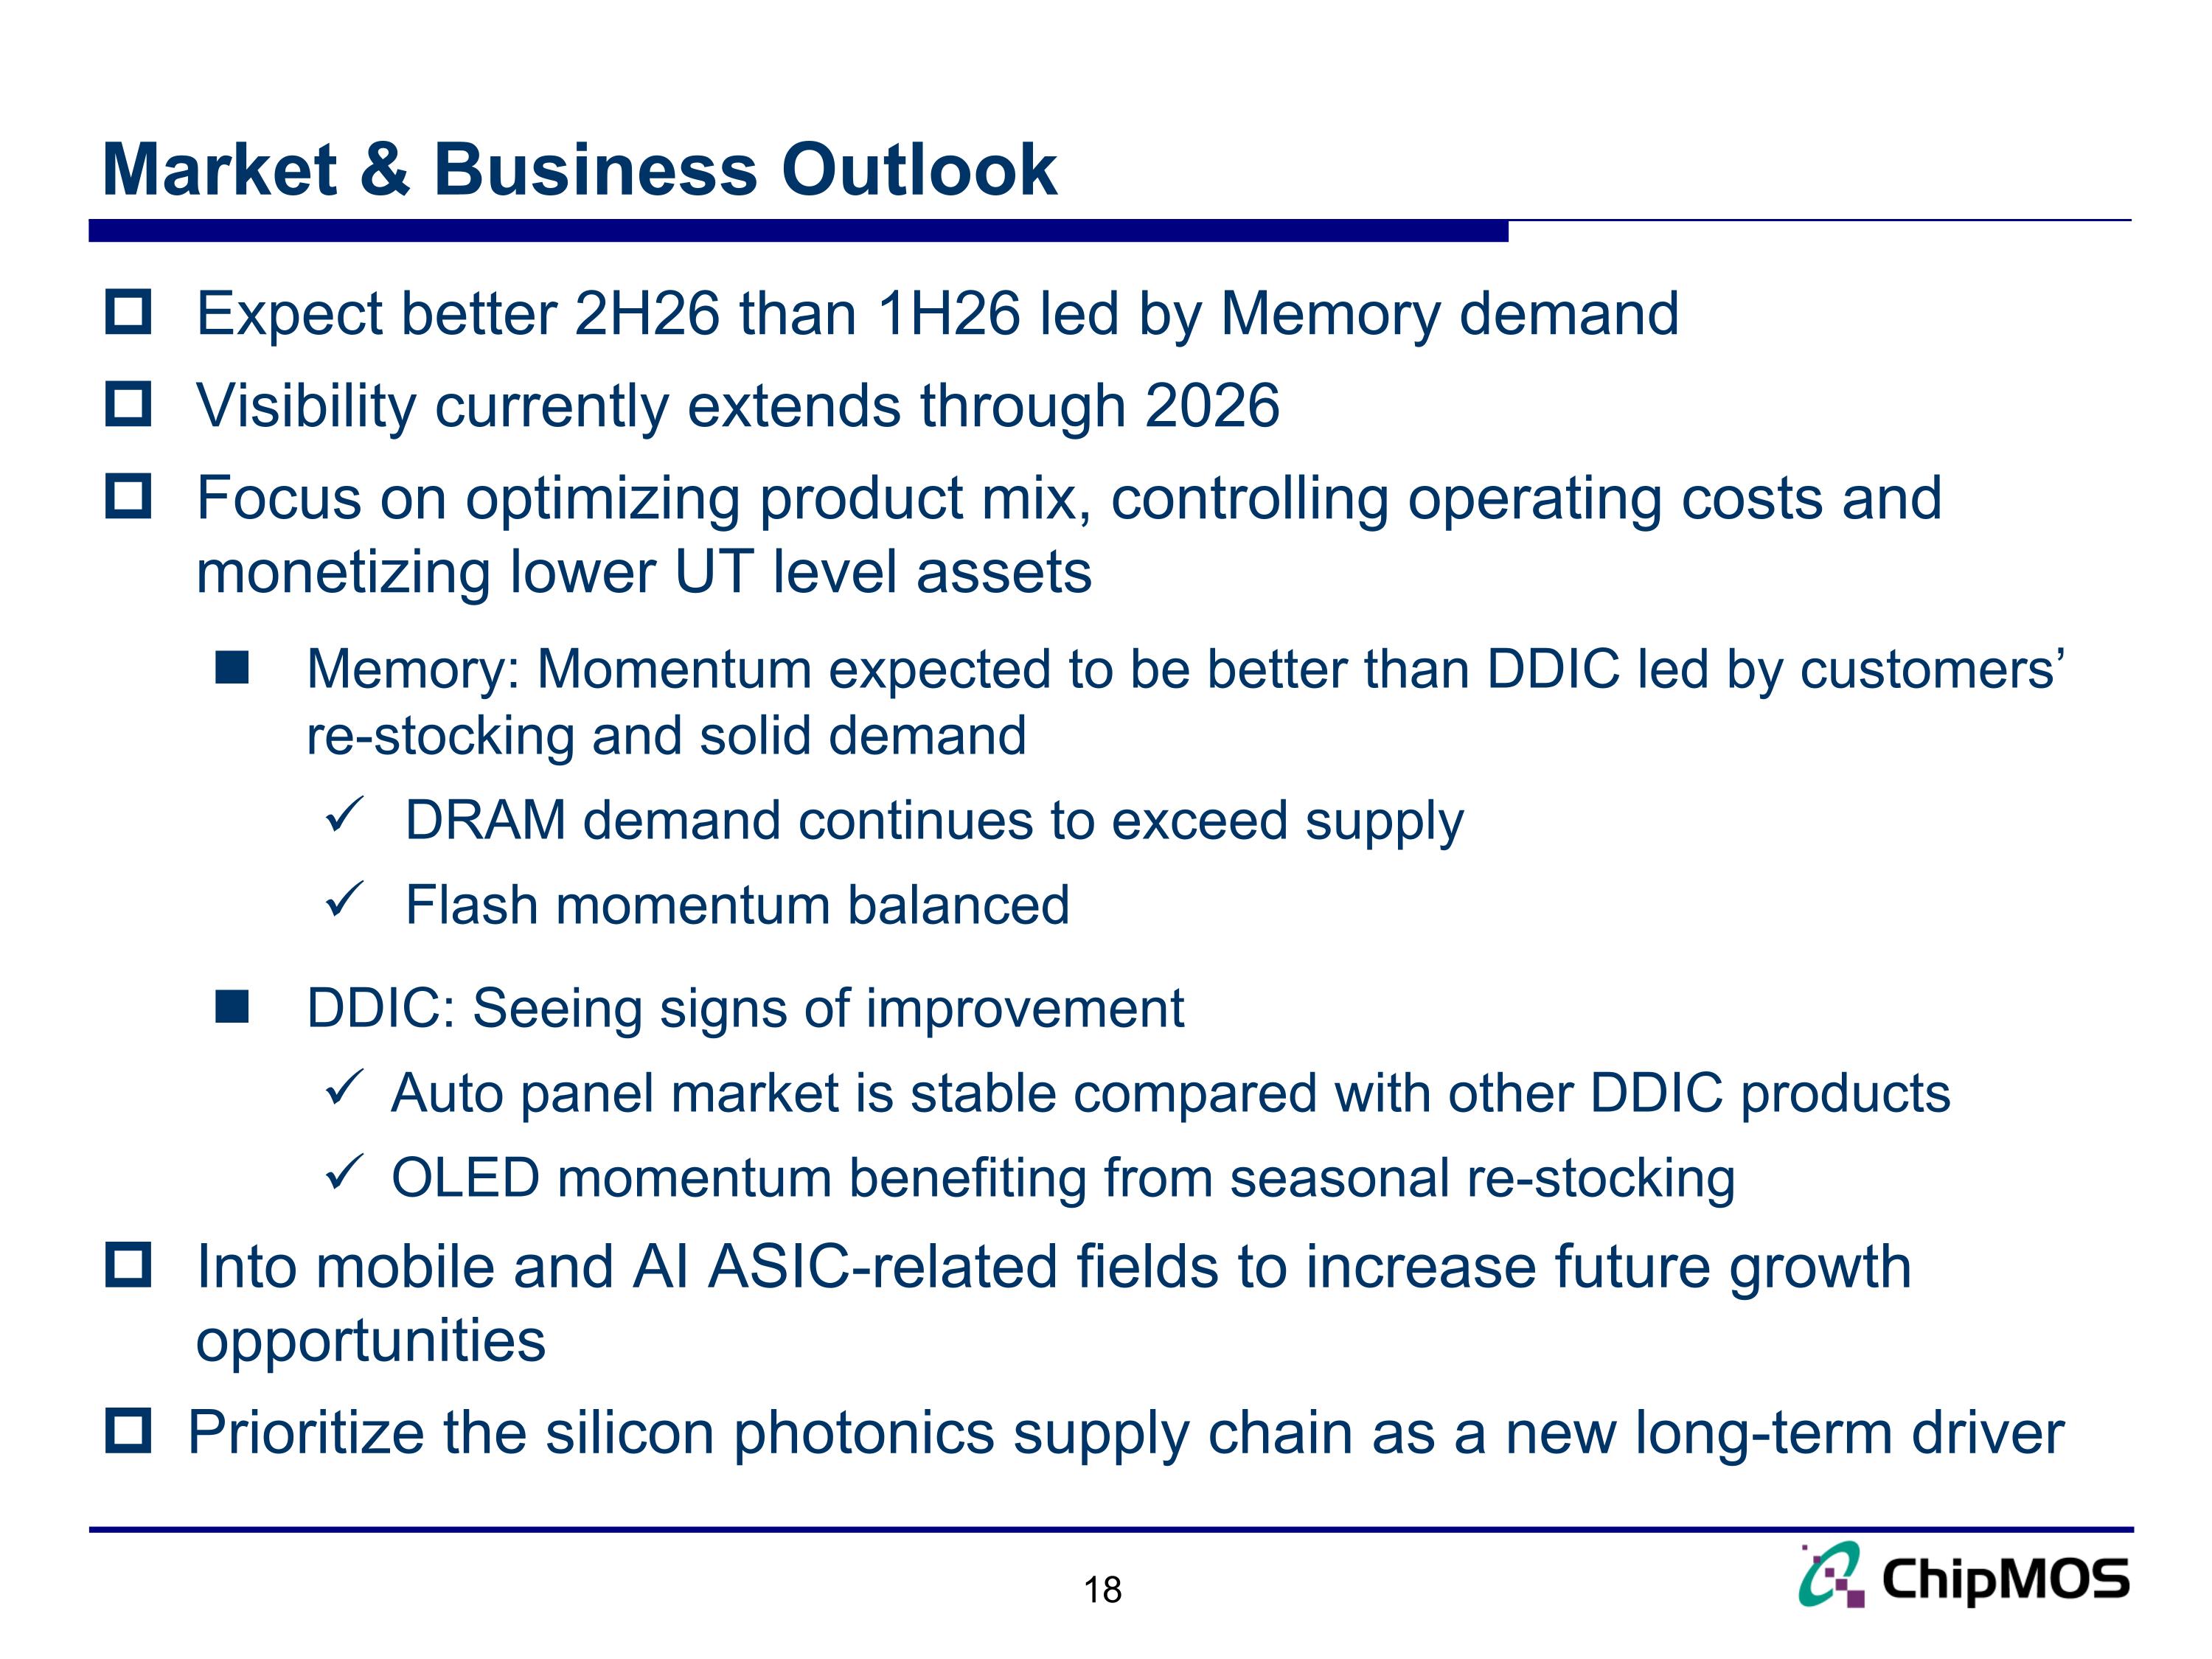
Market & Business Outlook Expect better 2H26 than 1H26 led by Memory demand Visibility currently extends through 2026 Focus on optimizing product mix, controlling operating costs and monetizing lower UT level assets Memory: Momentum expected to be better than DDIC led by customers’ re-stocking and solid demand DRAM demand continues to exceed supply Flash momentum balanced DDIC: Seeing signs of improvement Auto panel market is stable compared with other DDIC products OLED momentum benefiting from seasonal re-stocking Into mobile and AI ASIC-related fields to increase future growth opportunities Prioritize the silicon photonics supply chain as a new long-term driver
Q&A www.chipmos.com